We took 62,820 public LinkedIn posts from 1,340 creators, published between January 2025 and September 2026, and measured how far each post beat or missed that creator's own usual engagement. The short version: what you post about moves engagement more than the format, the length, the weekday, hashtags or links.
Format, length and weekday each shifted results by a few percent. Hashtags shifted them by nothing we could measure, and external links were associated with about 7% lower engagement. Post type moved them much further: product launches landed 13% below a creator's usual post and behind-the-scenes posts landed 20% above it.
Everything below is aggregated: charts, tables, the method and the limits. If you are choosing what to post about, read this next to our guide to content pillars, and for the plan around them see the LinkedIn content strategy guide.
Key findings
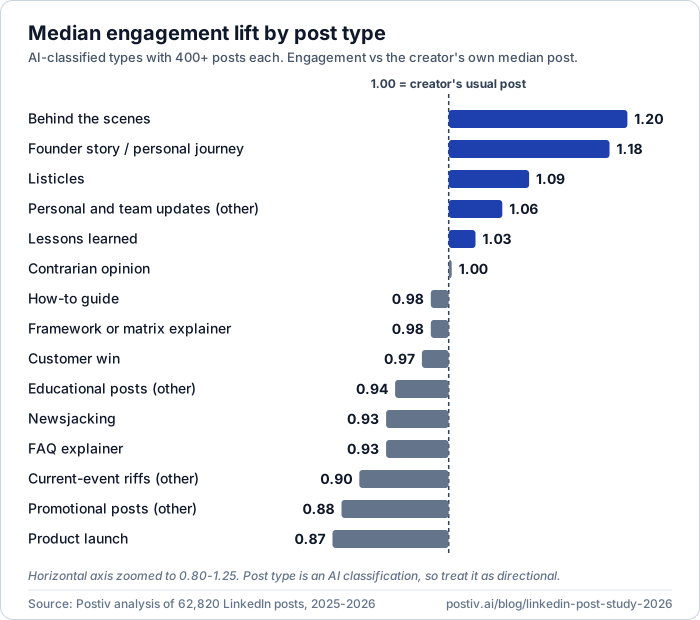
- Post type is the big lever: median lift ran from 0.87 for product launches to 1.20 for behind-the-scenes posts, a spread of 0.33.
- People beat promotion: behind-the-scenes (1.20) and founder-story (1.18) posts beat the creator's usual engagement, while product launches (0.87) and other promotional posts (0.88) fell 12 to 13% short.
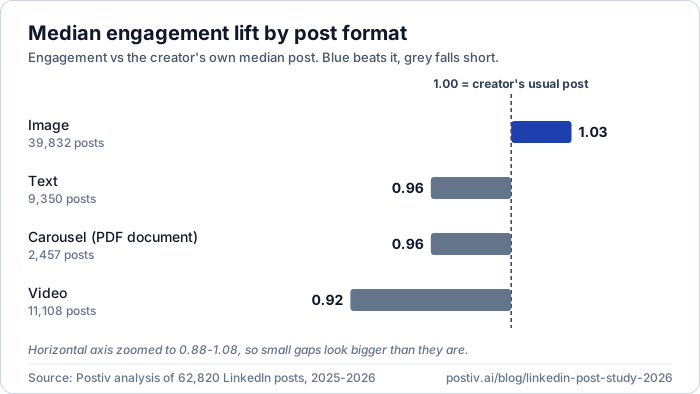
- Image posts led the formats at a median lift of 1.03, ahead of text and carousels at 0.96 and video at 0.92.
- Carousels did not win on total engagement, but they drew the most conversation: 0.447 comments per like against 0.271 for video, and the highest median comments per post (29).
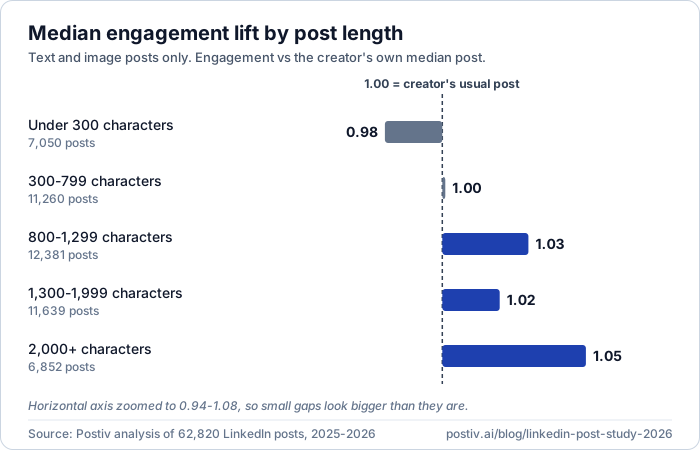
- Longer posts did slightly better: posts of 2,000 or more characters reached a median lift of 1.05, against 0.98 for posts under 300 characters.
- Hashtags made no measurable difference: median lift was between 0.98 and 1.00 whether a post had none or six or more.
- External links were associated with lower engagement: posts with an external link had a median lift of 0.93, about 7% below the creator's usual post, while posts that only tagged people or companies came in at 1.02.
- Weekday effects were small: Monday was highest at 1.05 and Saturday lowest at 0.96, with Tuesday, Wednesday and Sunday at 1.00.
How to read the numbers
Every figure here is a lift: a post's engagement divided by that creator's own median post engagement. A lift of 1.00 means "a normal post for this creator", 1.20 means 20% above their usual and 0.87 means 13% below. Engagement is likes (all reactions), comments and reshares as shown publicly, and every number in the post is a median across posts.
Comparing each creator with themselves matters. A post from a 200,000-follower account will usually collect more reactions than one from a 5,000-follower account, so raw counts mostly measure audience size. Lift removes that and leaves the question we care about: did this kind of post do better or worse than that person's usual?
The sample covers 1,340 creators with at least five qualifying posts each, and a median audience of about 52,700 followers.
| Creator audience | Creators |
|---|---|
| Under 10,000 followers | 203 |
| 10,000 to 50,000 | 446 |
| 50,000 to 200,000 | 419 |
| 200,000 and above | 272 |
1. Post type moved engagement the most
Post type is what a post is about and what it is for: a founder story, a how-to, a product launch. We classified every post with AI and kept the types with at least 400 posts. The chart shows all 15.
| Post type | Posts | Median lift |
|---|---|---|
| Behind the scenes | 1,340 | 1.20 |
| Founder story / personal journey | 5,412 | 1.18 |
| Listicles | 1,588 | 1.09 |
| Personal posts and team updates (other) | 4,819 | 1.06 |
| Lessons learned | 7,317 | 1.03 |
| Contrarian opinion | 6,642 | 1.00 |
| How-to guide | 8,950 | 0.98 |
| Framework or matrix explainer | 659 | 0.98 |
| Customer win | 412 | 0.97 |
| Educational posts (other) | 1,945 | 0.94 |
| Newsjacking | 8,147 | 0.93 |
| FAQ explainer | 2,168 | 0.93 |
| Current-event riffs (other) | 3,172 | 0.90 |
| Promotional posts (other) | 2,331 | 0.88 |
| Product launch | 2,260 | 0.87 |
The classifier left 4,980 posts unlabeled. Their median lift was 1.11, and we cannot say what they have in common, so we left them out of the chart.
What it means in practice. The top of the list is about people and experience: the work behind the work, a founder's own story, a short list, a lesson. The bottom is about products and news: launches, announcements, reactions to the day's topic. Newsjacking is the second most common type in the sample (8,147 posts) and still lands 7% below a creator's usual post. How-to guides, the most common type at 8,950 posts, sit just under usual at 0.98.
This does not mean "never announce a launch". It means launch posts, written the way creators usually write them, did worse than the same people's average output. One thing worth testing is attaching a person's story to the announcement: why you built it, what broke, what a customer said. That is an idea to test against your own numbers, not something this data proves.
2. Formats: image leads, but the gaps are small
We grouped posts by what the post contains. Carousel here means a PDF document post. Posts with several images count as image.
| Format | Posts | Share of posts | Median lift | Median comments | Comments per like |
|---|---|---|---|---|---|
| Image | 39,832 | 63.5% | 1.03 | 22 | 0.334 |
| Text | 9,350 | 14.9% | 0.96 | 18 | 0.373 |
| Carousel (PDF document) | 2,457 | 3.9% | 0.96 | 29 | 0.447 |
| Video | 11,108 | 17.7% | 0.92 | 16 | 0.271 |
Image posts were the only format above a creator's usual, at 1.03. Video sat lowest at 0.92. From first to last that is a spread of 0.11, about a third of the 0.33 spread between post types.
Read the image number with care. Nearly two thirds of all posts are images, so a creator's "usual post" is mostly an image post, which pulls image lift toward 1.00 and measures the other formats against an image-heavy baseline.
What it means in practice. Format is a smaller lever than topic. Turning a weak idea into a video will not rescue it, and a strong idea does not need a particular format to land. Choose the format that suits the idea, then spend your effort on the idea. Our guide to the types of LinkedIn posts shows what each one is good at. Public data cannot see watch time or video views, so the low video number says nothing about how well video builds familiarity.
3. Carousels: not the most engagement, but the most conversation
Carousels did not win on total engagement. Their median lift was 0.96, behind image posts at 1.03 and level with text. What they won was conversation.
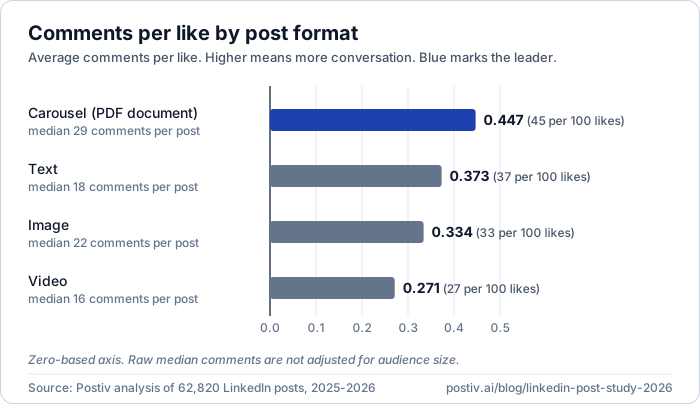
Carousels drew 0.447 comments per like, about 45 comments for every 100 likes. Text posts drew 0.373, images 0.334 and video 0.271. Carousels also had the highest median comments per post at 29, against 22 for images, 18 for text and 16 for video.
Why? Public data cannot tell us. Plausible reasons include readers commenting on a specific slide, or authors asking for a comment in exchange for the file. We did not test either, so treat both as guesses.
Two cautions. Carousels are the smallest group, with 2,457 posts from 474 creators (3.9% of the sample), and creators who post carousels may differ from those who do not. And median comments is a raw count, not adjusted for audience size. Comments per like is the fairer comparison, because both sides of that ratio grow with audience.
What it means in practice. If the goal is conversation, such as replies from prospects, questions in the comments or a thread worth joining, carousels deserve a place in the mix. If the goal is the most total reactions, this data points to images. Our post on LinkedIn carousel best practices covers how to build ones that people finish.
4. Length: longer posts did slightly better
This one covers text and image posts only, 49,182 posts.
| Post length | Posts | Median lift |
|---|---|---|
| Under 300 characters | 7,050 | 0.98 |
| 300 to 799 characters | 11,260 | 1.00 |
| 800 to 1,299 characters | 12,381 | 1.03 |
| 1,300 to 1,999 characters | 11,639 | 1.02 |
| 2,000 characters or more | 6,852 | 1.05 |
The spread is 0.07 and the pattern is not a straight line, since 1,300 to 1,999 characters sits just below 800 to 1,299. Because lift compares each creator with their own usual, this is not just big accounts writing long posts.
What it means in practice. Short posts were not punished much (0.98), and long posts were rewarded a little. Write as long as the idea needs. If you have 900 characters of substance, do not cut it to look tight, and do not pad a thin idea to reach 2,000. The LinkedIn post character limit guide covers the 3,000-character cap and where the "see more" cut-off falls.
5. External links trailed, hashtags made no difference
We looked at two old debates. Hashtags showed nothing. External links did.
| Hashtags in the post | Posts | Median lift |
|---|---|---|
| None | 47,122 | 1.00 |
| 1 to 2 | 4,455 | 0.99 |
| 3 to 5 | 5,654 | 1.00 |
| 6 or more | 5,516 | 0.98 |
For links, we split posts three ways, because tagging a person or a company puts a LinkedIn profile URL in the text and is not a link out of LinkedIn.
| Link in the post | Posts | Median lift |
|---|---|---|
| External link (lnkd.in short link or non-LinkedIn URL in the text) | 14,031 | 0.93 |
| Only tags people or companies, no external URL | 21,033 | 1.02 |
| No link and no tag | 27,683 | 1.00 |
Three out of four posts used no hashtags at all, and posts that did use them had a median lift between 0.98 and 1.00. Posts with an external link had a median lift of 0.93, about 7% below the creator's usual post. Posts that only tagged people or companies did not suffer: they came in at 1.02.
Treat that as an association, not proof. We compared different posts, not the same post with and without a link, and links may travel with weaker post types such as launches and announcements, which we did not separate out. We also measured engagement, not impressions, so the data says nothing about reach. And it does not test whether a link in the first comment behaves differently.
What it means in practice. Do not spend time on hashtag counts. Tag people and companies freely. If a link is not essential to the post, consider leaving it out or moving it to the first comment, and compare the results on your own account, since this study cannot say whether that helps. For the details, see LinkedIn hashtags, how to post a link on LinkedIn and the questions on links in our LinkedIn algorithm guide.
6. Weekday: Monday edged ahead, Saturday trailed, all of it small
| Weekday (UTC) | Posts | Median lift |
|---|---|---|
| Monday | 10,323 | 1.05 |
| Tuesday | 11,295 | 1.00 |
| Wednesday | 11,060 | 1.00 |
| Thursday | 10,913 | 0.99 |
| Friday | 10,020 | 0.98 |
| Saturday | 4,456 | 0.96 |
| Sunday | 4,680 | 1.00 |
The range from Saturday to Monday is 0.09, and Sunday goes back to 1.00. Only 14.6% of posts went out on a weekend. Days are in UTC, so a late Sunday post from the US west coast counts as Monday, and we did not analyze time of day.
What it means in practice. A day-of-week tweak is worth a few points at most. Pick the days you can keep up, and use the extra thought for what the post says. If you want to test one thing, try a Monday slot. For time-of-day questions see the best time to post on LinkedIn, and for cadence see how often to post on LinkedIn.
Methodology
- Source. Public LinkedIn posts from creators tracked in Postiv's inspiration library, collected by our crawler. We used posts published from January 1, 2025 to September 30, 2026 and excluded reposts.
- Maturity filter. A post counts only if its engagement was last observed at least three days after it was published. Most engagement lands in the first 48 to 72 hours, so this drops posts captured on day one, whose counts are early snapshots.
- Creator filter. Creators with at least five qualifying posts.
- Result. 62,820 posts from 1,340 creators. The median creator has about 52,700 followers.
- Engagement. Likes (all reactions) plus comments plus reshares, as shown publicly. There are no impressions, because public data has no reach numbers.
- Lift. A post's engagement divided by that creator's own median post engagement, so 1.00 is the creator's usual post. Every figure is a median across posts.
- Breakdowns. The format, hashtag, link and weekday tables each cover 62,747 posts. The other 73 belong to one creator whose median engagement is zero, so lift cannot be computed for them. The length chart covers text and image posts only.
- Links. An external link is a lnkd.in short link or a non-LinkedIn URL in the post text. Posts that only tag people or companies (linkedin.com/in or linkedin.com/company URLs) are counted separately, since a mention is not a link out of LinkedIn.
- Post type. AI classification, with types of fewer than 400 posts left out.
- Weekday. Publish day in UTC.
- Privacy. Only aggregates are published. We do not name creators or quote posts.
Limitations and caveats
- Not a random sample. The creators are a curated set of active LinkedIn creators, mostly B2B, tech, marketing and founders. Results may not carry over to a small account or a different industry.
- Engagement, not reach. A format could reach more people without engagement rising, or the reverse.
- Correlation, not causation. Creators choose formats and topics for reasons. We looked at each factor separately, not together, so some of a post type's lift could come from the format or length it tends to use, and links may travel with weaker types such as launches.
- Post type is directional. It is an AI classification, and some posts fit more than one type.
- Carousel means PDF document posts. The group is small, and creators who post carousels may differ from those who do not.
- The baseline is image-heavy. Because most posts are images, each creator's usual post leans toward an image post.
- Weekday uses UTC. Effects are small either way.
- No audience-size split in this edition. Effects could differ for accounts under 10,000 followers or over 200,000.
- Do not over-read a point or two. Posts from the same creator are not independent, so differences of 0.01 to 0.02 may not mean anything.
- A moving target. The window runs January 2025 to September 2026, and LinkedIn changes its feed.
What to do with this
Treat these as defaults to test against your own account, not rules.
Formats by goal
| If your goal is | Lean on | What the data says |
|---|---|---|
| The most total engagement | Image posts | Highest median lift of any format (1.03) |
| More conversation in the comments | Carousels | Most comments per like (0.447) and the highest median comments (29) |
| Quick thinking without design work | Text posts | Lift 0.96 and the second-highest comments per like (0.373) |
| Showing something moving or spoken | Video, when the idea needs it | Lowest engagement measured (0.92 lift, 0.271 comments per like), with watch time unseen |
Post types
- Make room for people and process. Behind-the-scenes posts, founder stories, listicles and lessons learned all landed above a creator's usual.
- Keep promotion, but do not lead with it. Product launches (0.87) and other promotional posts (0.88) had the lowest lift. Test pairing each announcement with the story behind it.
- Be choosy with news reactions. Newsjacking (0.93) and current-event riffs (0.90) are common but landed below usual.
- Keep the how-tos. At 0.98 they sit close to usual, so they are not a drag, they just do not lift.
Length
Write as long as the idea needs. Posts of 800 characters and up did slightly better and short posts were not punished much, so there is no case for padding or for cutting a good post short.
What not to spend time on
Hashtag counts and finding the perfect weekday. Neither moved engagement by more than a few points here. External links are the one to watch: posts with one trailed by about 7%, so keep a link in the post only when it earns its place.
Turn it into content pillars
The post type result is the strongest argument for planning on purpose. If what you post about matters more than format, length or timing, then choosing your themes is the highest-leverage step. Our guide to content pillars shows how to pick yours, and the free content pillar generator drafts a starting set from your website or LinkedIn URL.
One way to apply this study: give one pillar to behind-the-scenes and founder-story territory, one to lessons and lists, and one to proof tied to what you sell, and keep straight promotion to a minority of slots. Then tag each post with its pillar and format so you can check it against your own numbers.
Check it against your own numbers
Take your last 20 to 30 posts, find your median engagement and divide each post's engagement by it. Group the results by post type and format. If your own lift for a type is far from the table above, trust your account over this study. The free LinkedIn engagement rate calculator covers rate per post.
How Postiv uses this
Postiv is a social workspace for you, your team and your agent. This study comes from the posts in its inspiration library, where the outlier filter shows posts that earned three times or more their creator's usual engagement, the same idea as lift. Bob, Postiv's planning and writing agent, plans your week from your content pillars, sources and the last 30 days of results (see how Bob plans your content), and analytics shows how each pillar is doing against your average. Postiv has a 7-day free trial.
Cite this study
Postiv. (2026, October). We analyzed 62,820 LinkedIn posts: what actually lifts engagement in 2026. https://postiv.ai/blog/linkedin-post-study-2026
Short form: Postiv analysis of 62,820 LinkedIn posts, 2025-2026 (postiv.ai/blog/linkedin-post-study-2026).
You are welcome to quote any figure or reuse the charts with a link back to this page.
FAQ
What is the best post format for engagement on LinkedIn in 2026?
In our sample of 62,820 posts, image posts led with a median lift of 1.03, which means 3% above the creator's own usual post. Text and carousel posts sat at 0.96 and video at 0.92. The gaps between formats are small next to the gaps between post types, so choose the format that fits the idea.
Do LinkedIn carousels get more engagement?
Not more total engagement. Carousels had a median lift of 0.96, below image posts at 1.03. They did draw the most conversation, with 0.447 comments per like against 0.334 for images, 0.373 for text and 0.271 for video, and the highest median comments per post (29). Carousel here means PDF document posts.
What type of LinkedIn post performs best?
Behind-the-scenes posts (1.20) and founder stories (1.18) had the highest median lift, followed by listicles (1.09). Product launches (0.87), other promotional posts (0.88) and current-event riffs (0.90) had the lowest. Post type is an AI classification, so treat the ranking as directional.
How long should a LinkedIn post be?
Longer posts did slightly better. For text and image posts, 2,000 or more characters had a median lift of 1.05, 800 to 1,299 characters 1.03 and under 300 characters 0.98. The effect is small, so write as long as the idea needs instead of aiming for a number.
Do hashtags or external links hurt LinkedIn engagement?
External links were associated with lower engagement, hashtags were not. Posts with an external link had a median lift of 0.93, about 7% below the creator's usual post, while posts that only tagged people or companies had 1.02. Hashtag counts from none to six or more all sat between 0.98 and 1.00. This is an association, and we measured engagement, not impressions.
What is the best day to post on LinkedIn?
Monday had the highest median lift (1.05) and Saturday the lowest (0.96), with Tuesday, Wednesday and Sunday at 1.00. Days are in UTC and the effects are small, so pick days you can keep up.
What does engagement lift mean?
Lift is a post's engagement divided by that creator's own median post engagement. A lift of 1.00 is the creator's usual post, 1.20 is 20% above it and 0.87 is 13% below it. Each creator is compared with themselves, so audience size does not distort the comparison between formats.
Does this data apply to my LinkedIn account?
Treat it as a starting point. The 1,340 creators are active accounts, mostly B2B, tech, marketing and founders, with a median audience of about 52,700 followers, and the data covers engagement, not reach. Test the findings against your own recent posts before you change your plan.
Can I cite or reuse this study?
Yes. Quote any figure or reuse the charts with a link back to this page. Cite it as "Postiv analysis of 62,820 LinkedIn posts, 2025-2026" with the URL postiv.ai/blog/linkedin-post-study-2026.