

Analytics
See What Landed. Plan the Next Week From It.
Every post and every profile, measured in one place. Spot the outliers, see which formats work across your team, and let next week's plan start from your winners.
Analytics on every plan
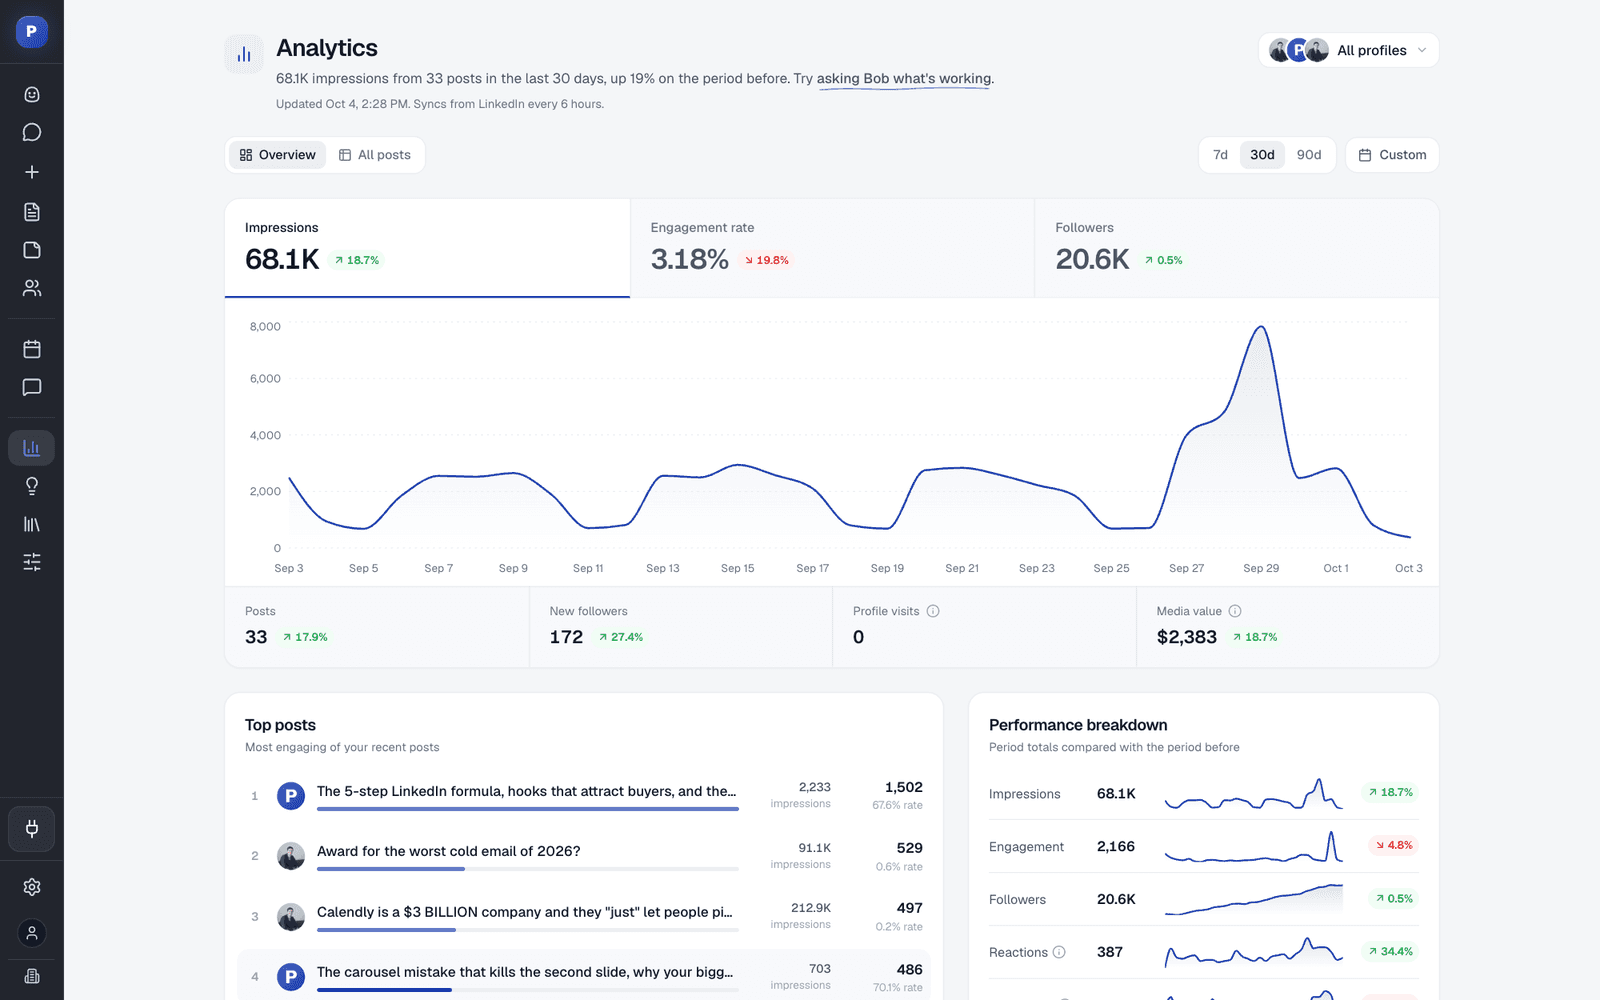
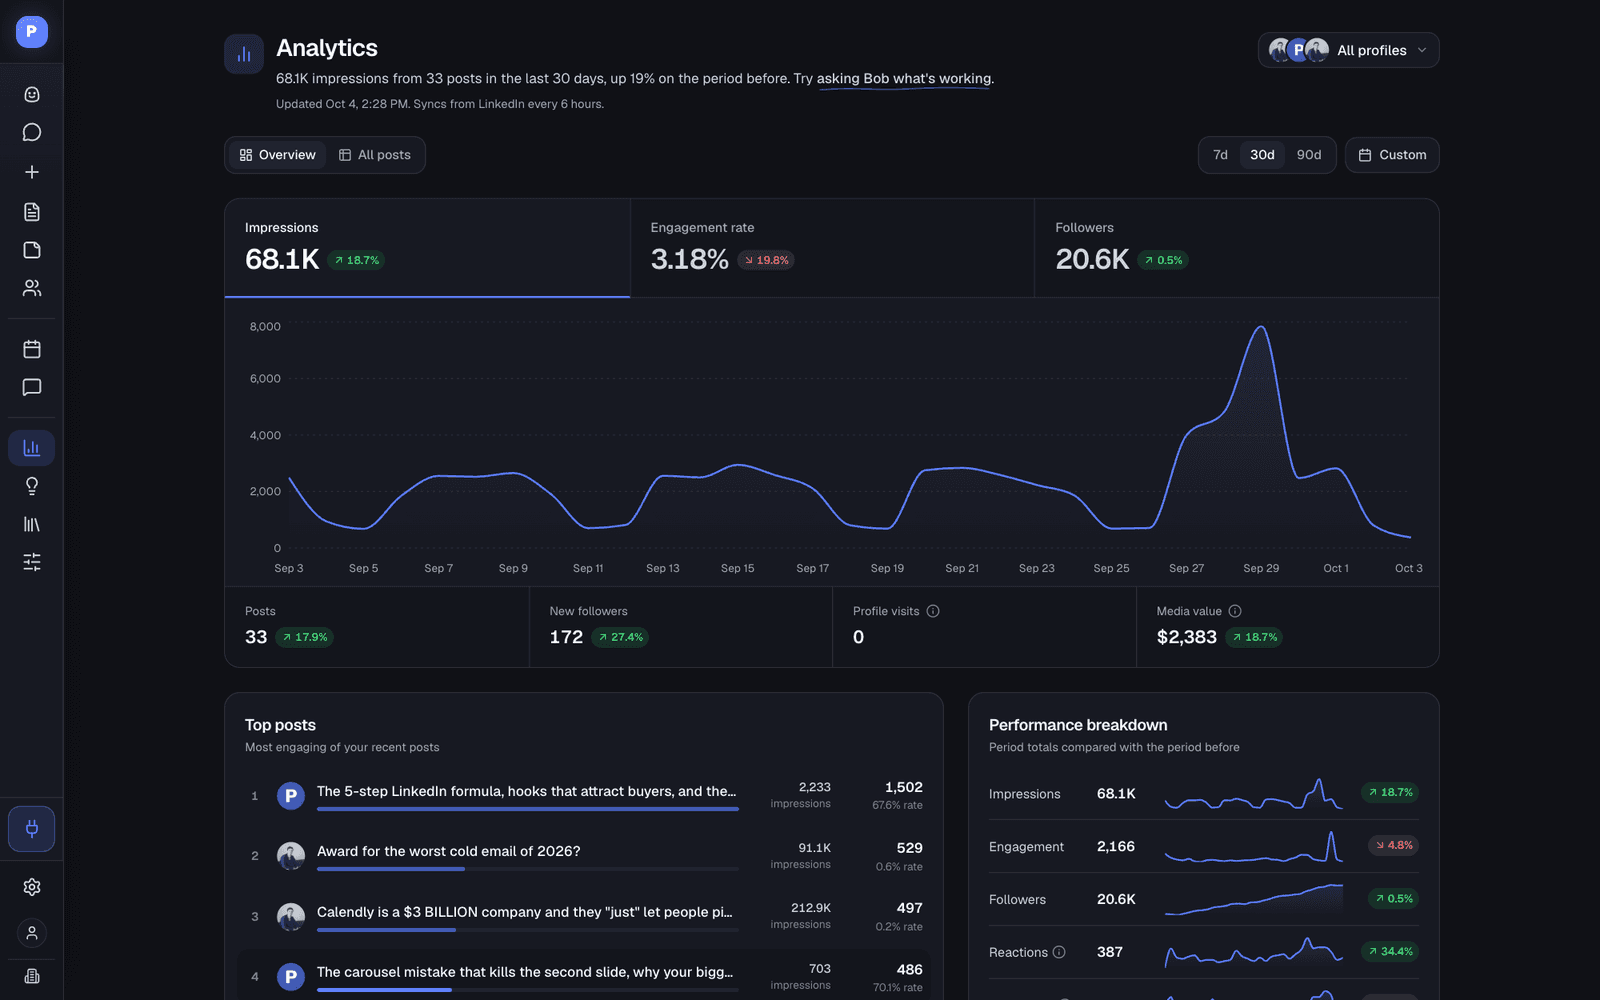
Seven KPIs against the previous period
Profiles and company pages together
Top posts and outliers
Pillar results feed the next plan
The Overview
The Numbers That Tell You What to Post Next
Not a wall of charts. The overview answers one question: what should you do more of?
KPIs with deltas
Posts, impressions, followers, engagement rate, net new followers, profile visits and EMV, each against the previous period.
Outlier posts
Posts that beat the profile's usual engagement, so you know which idea or format to repeat.
Team patterns
Which formats work across several profiles over the last 90 days, not just for one person.
Every post, one table
The Posts tab lists your full history, with a detail page for each post.
Any time range
7, 30 or 90 days, or a custom range, for all accounts or one profile.
Ask Bob
Open a chat about your analytics and ask which posts did best or which formats get engagement.
Spot, Adapt, Learn
Results That Change What You Post
Analytics only matter when they change next week. In Postiv they do, automatically.
- 1
Measure
Postiv syncs your post and profile results from LinkedIn.
- 2
Score each pillar
Each content pillar gets its last 30 days: posts, average impressions and engagement against your average.
- 3
Plan from winners
Bob's next weekly plan leans on the pillars and formats that worked.
Straight Answer
Analytics, Plainly
What the numbers cover, and what LinkedIn does not share.
What it does
- Tracks personal profiles and company pages you connect
- Compares every KPI with the previous period
- Flags outlier posts and cross-profile patterns
- Feeds pillar performance into Bob's weekly plan
What to know first
- No personal-profile demographics. LinkedIn does not share follower demographics for personal profiles with third-party tools.
- EMV is an estimate. It assumes $35 per thousand impressions to compare periods, and is not a LinkedIn metric.
- Connect analytics access first. Analytics need LinkedIn's analytics permission, which you grant once when connecting.
FAQ
Frequently Asked Questions
Which LinkedIn metrics does Postiv track?
Posts, impressions, followers, engagement rate, net new followers, profile visits and an estimated media value, each compared with the previous period. Every post also has its own detail page.
Which time ranges can I look at?
The last 7, 30 or 90 days, or a custom date range. The Posts tab lists your full post history.
Can I see company page analytics?
Yes. Company pages are tracked next to personal profiles, including follower growth. LinkedIn gives richer page-level data for company pages than for personal profiles.
Does Postiv show follower demographics for my personal profile?
No. LinkedIn does not share follower demographics for personal profiles with third-party tools. Company pages get more page-level data.
What is EMV?
Estimated media value: what your impressions would have cost as paid reach, at an assumed $35 per thousand impressions. It is an estimate to compare periods, not a LinkedIn metric.
How do analytics feed into my plan?
Each content pillar's last 30 days of posts, impressions and engagement go into Bob's next weekly plan, so the week starts from your winners. You can also ask Bob about your numbers in chat.
Start Next Week From Your Winners
Connect LinkedIn and see your last 90 days in one view. Try Postiv free for 7 days, cancel anytime.
Which LinkedIn Metrics Actually Matter
Impressions tell you reach, but engagement rate and profile visits tell you whether the right people cared. Compare every number with the previous period, and look for outliers rather than averages: one post that did three times better than usual teaches you more than a monthly total.
Our LinkedIn analytics guide goes deeper on each metric, and the free engagement rate calculator checks a single post. When you know what works, the ideation agent turns it into next week's plan.
Last updated
More Postiv Features
All features- Ideation agentBob plans your posting week: one idea per slot, tied to your content pillars, your sources and last week's results.
- Content creationPosts, carousels, images and infographics on your brand. Draft with AI, finish in your own words.
- Team managementEvery profile and company page in one workspace, with roles, approvers per profile and a Team Hub.
- SchedulingOne calendar for every profile, company page and channel, with posting slots and an automatic first comment.
- EngagementEvery comment on every profile in one inbox, plus a feed of the people you want to engage with.
- Inspiration librarySee which LinkedIn posts are taking off in your niche, spot the outliers, and turn the idea and format into your own post.
- Knowledge baseYour website, documents, YouTube, Notion and newsletters in one library, so every idea and draft starts from your own material.