LinkedIn Analytics That Tell You What to Post Next
See which posts brought reach, engagement and followers across your profile, your team and your company page. Then write next week's posts in the same place.
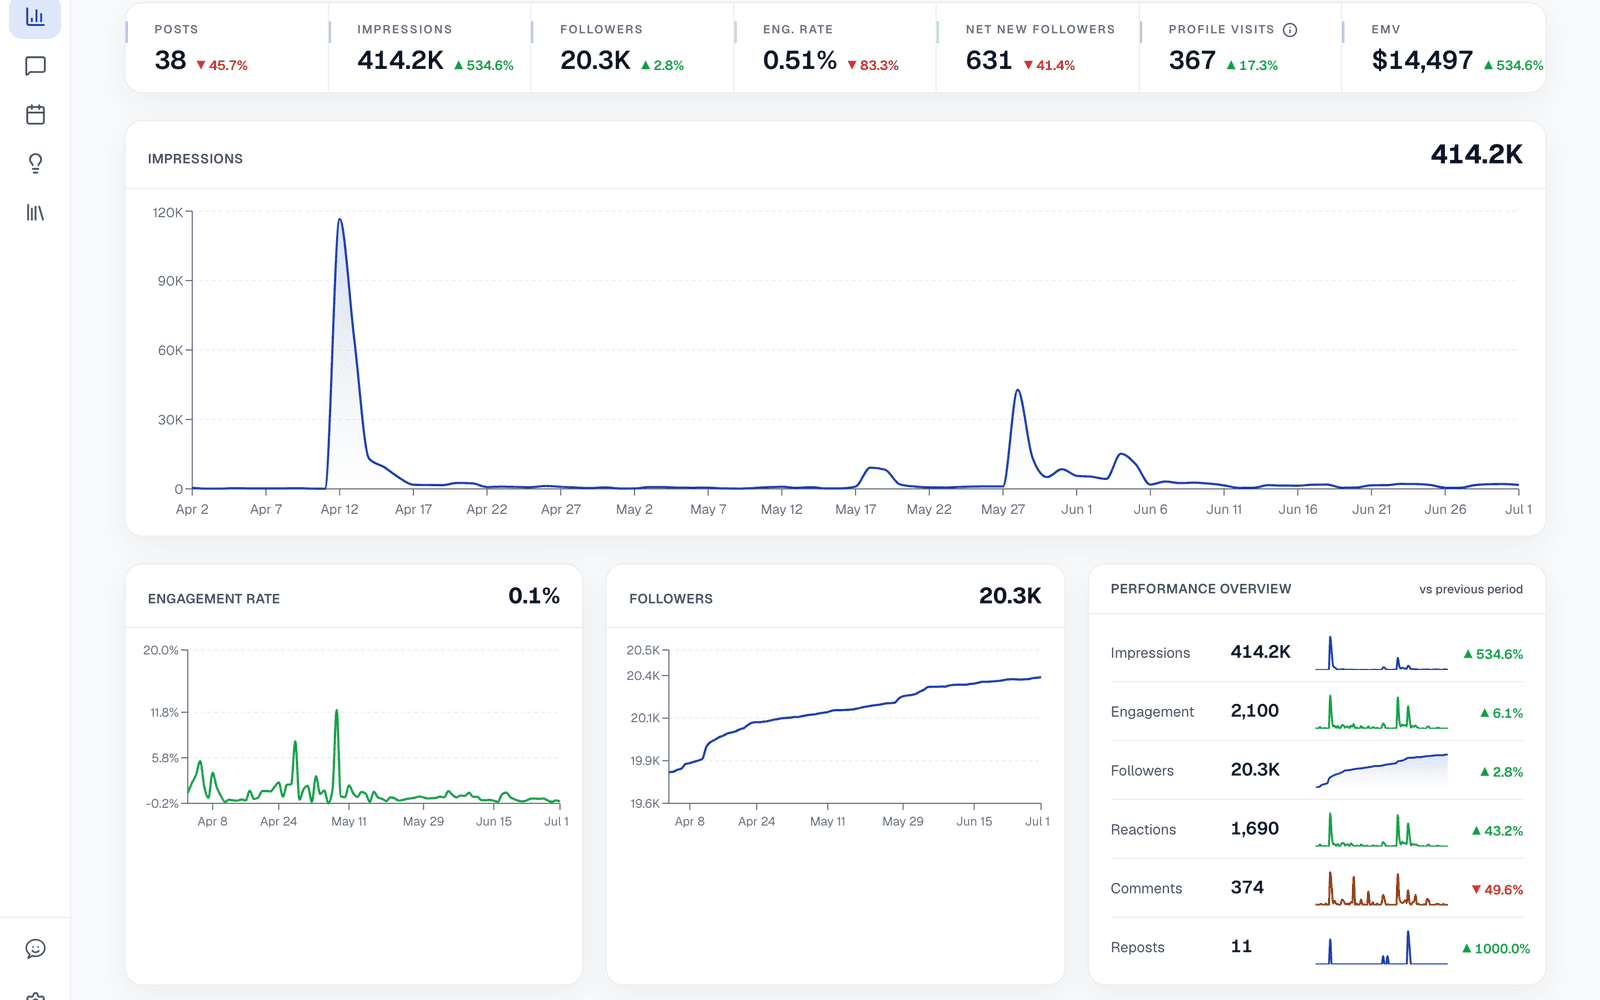
The actual analytics dashboard with real account data. Not a mockup.
What You Can Track
The LinkedIn Numbers That Matter, in One Dashboard
No spreadsheet exports, no clicking into posts one by one. Postiv keeps your LinkedIn post analytics up to date and lines them up so patterns are easy to see.
Every post, every number
Impressions, reactions, comments, reposts, saves, engagements and engagement rate for each post, with reach, sends, link clicks and video plays in the post detail. Sort by any column and filter by text, image, carousel or video.
Growth over time
Impressions, engagement rate and followers charted over 7, 30 or 90 days or any custom range, with every headline number compared to the previous period.
Top posts and outliers
Your best posts of the period, plus the ones that beat your own average reach, engagement, or results for that format. Your baseline, not an industry benchmark.
Followers and profile visits
Total followers, net new followers and profile visits, so you can see which weeks of posting actually grew the audience.
Your history, imported
Connect through LinkedIn's official analytics access and Postiv imports up to 12 months of posts, including the ones you wrote directly on LinkedIn. You get an email when your dashboard is ready.
The whole team in one view
Switch between profiles or read all accounts together. With two or more profiles, see which formats lift results across the team and which profiles perform alike.
Ask Bob about your numbers
Ask in plain words: which posts did best this month, which days work, which formats get engagement. Bob answers with your data and a chart.
Your analytics in Claude or ChatGPT
Postiv's MCP server lets your own AI assistant read your summary, top posts, outliers and single-post numbers.
Official LinkedIn data
Numbers come from LinkedIn's official analytics API, refreshed automatically. No browser extension, no spreadsheet uploads.
Straight Answer
Personal Profiles vs Company Pages
LinkedIn decides what data it shares with outside tools, and it shares more for company pages than for personal profiles. Here is what that means in Postiv, so nothing surprises you after you connect.
Personal profile
- Impressions, reactions, comments and reposts per post
- Engagement rate, top posts and outliers
- Followers and profile visits over time
- Your post history, including posts written on LinkedIn
- No follower demographics. LinkedIn does not give any outside tool the industry, seniority or location of a personal profile's followers. You can still see them inside LinkedIn.
Company page
- Impressions, reactions, comments and reposts per post
- Engagement rate, top posts and outliers
- Follower count and daily follower growth
- Read next to the founder and team profiles that post for it
- No saves. LinkedIn does not report saves for company page posts.
This limit applies to every LinkedIn analytics tool, not just Postiv. A tool that promises personal follower demographics is estimating them.
Write, Publish, Measure. Then Repeat.
Analytics in a separate tool gets checked once a quarter. Analytics next to your drafts gets used every week.
1. Write
Draft posts and carousels with Bob, Postiv's AI content partner, in your own voice.
2. Publish
Schedule to your profile or company page on a calendar that auto-publishes.
3. Measure
See what landed in analytics. Bob's weekly plan takes each content pillar's last 30 days into account, and you can ask him about any post.
Why Not Just Use LinkedIn?
LinkedIn's Own Analytics vs Postiv
LinkedIn's built-in analytics
- One profile or page at a time
- Post numbers opened one post at a time
- No comparison with your own average
- Separate from where you write and schedule
Postiv LinkedIn analytics
- Profiles and company pages in one view
- Every post in one sortable table
- Outliers against your own baseline
- Next to your drafts, calendar and Bob
FAQ
Frequently Asked Questions
A LinkedIn analytics tool pulls the performance data behind your posts (impressions, reactions, comments, reposts and follower growth) into one place, so you can see which posts worked and why. LinkedIn shows these numbers post by post. A dedicated tool like Postiv lines them up over time, compares each post with your own average, and puts several profiles side by side.
For each post: impressions, reactions, comments, reposts, saves, engagements and engagement rate, plus members reached, sends, link clicks, follower gains and video plays where LinkedIn reports them. For each profile or page: posts published, impressions, followers, net new followers and profile visits, each compared with the previous period. Postiv also flags posts that beat your usual reach or engagement, and posts that beat your usual results for that format.
No. LinkedIn does not give any third-party tool access to follower demographics (industry, seniority, location) for personal profiles. You can still see them inside LinkedIn itself. Company pages are treated differently: LinkedIn shares more page-level data with outside tools, such as daily follower growth. Postiv's dashboard focuses on post performance and follower growth for both.
Yes. Connect a LinkedIn company page and Postiv tracks its posts, follower count and daily follower growth next to your personal profiles, so a founder's profile and the company page can be read in one dashboard. One difference: LinkedIn does not report saves for company page posts.
Yes. When you connect a profile, Postiv imports up to 12 months of post history through LinkedIn's official analytics access, including posts you wrote directly on LinkedIn, and emails you when it is ready. After that the numbers refresh automatically: each new post is re-checked several times in its first day, then daily for a month. There is no spreadsheet to export or upload.
Yes, on the Team and Agency plans. Switch between each connected profile or look at all accounts together, and see which posting patterns lift results across the whole team. Every plan includes analytics for your own profile.
Yes. Postiv's MCP server gives your own AI assistant read access to your analytics: a summary for any period, daily performance, your top posts and outliers, and the numbers behind a single post.
You can try it free with a 7-day free trial. Analytics for your own profile is included on every paid plan, including Creator Light. Asking Bob about your numbers needs a plan with Bob, such as Creator Pro. Team-wide analytics comes with the Team and Agency plans.
Know What Worked. Post More of It.
Connect your LinkedIn profile, let Postiv import your history, and see your best posts side by side. Try Postiv free for 7 days, cancel anytime.
How to Use LinkedIn Analytics to Grow
Start with impressions, the number of times your post was shown in someone's feed. Our guide on what an impression means on LinkedIn explains why it is a reach number, not an audience number. Then look at engagement rate: engagements divided by impressions. You can check a single post with our free LinkedIn engagement rate calculator.
The most useful comparison is with yourself. A post at 1.2% engagement is a win if you usually sit at 0.8%, whatever an industry average says. That is why Postiv marks outliers against your own baseline, and why our walkthrough on how to analyze content performance starts from your history rather than benchmarks.
Finally, turn what you learn into next week's plan. If carousels keep beating your text posts, make more with the LinkedIn carousel generator, then queue them on the LinkedIn post scheduler. When you need to show the value to a manager or client, our guide to measuring social media ROI connects these numbers to pipeline.
Last updated