Let's get real about social media ROI. It's not about counting likes; it's about connecting the dots between your investment—all the time, money, and creative energy you pour into it—and what actually hits your company's bottom line.
This guide is about moving past the feel-good numbers and getting down to the actual financial return of your social media campaigns.
Why Likes and Shares Don't Pay the Bills
We've all been there. You post something, the likes and shares roll in, and it feels like a huge win. It's tempting to slap those numbers on a report and call it a day. But those "vanity metrics" don't tell the whole story, and they certainly don't convince a CEO to open up the budget. Even a metric like impressions on LinkedIn, while foundational for measuring visibility, only becomes meaningful when connected to downstream business results.
For B2B founders and marketers, especially on a platform like LinkedIn, the game is different. We're not just here to be popular; we're here to drive tangible business outcomes.
Moving Beyond Engagement Scores
Measuring true ROI means shifting your focus from surface-level stats to the numbers that actually reflect business growth. It's about telling a financial story with your data.
Instead of just celebrating a high like count, we need to be asking tougher questions:
- Qualified Leads Generated: How many real, potential customers did that LinkedIn post actually bring into our sales funnel?
- Pipeline Growth: What's the dollar value of the sales opportunities we created directly from our social channels?
- Closed Deals: Can we trace new customer revenue all the way back to a specific social campaign or even a single interaction?
Building authority online is fantastic, but that influence has to lead somewhere. A massive follower count is just a starting point, not the ultimate goal. Every single post, comment, and connection should be a deliberate piece of a larger strategy designed to grow the business.
The biggest mistake I see is confusing activity with impact. A post can go viral and get thousands of likes, but if it doesn't generate a single demo request or lead, its ROI is effectively zero. Your focus has to be on creating content that drives action.
This change in perspective is everything. High engagement is great, and it's often a leading indicator of success. (You can learn more about how to increase social media engagement in a way that supports your business goals).
Ultimately, though, the only measure that truly matters is whether your social media presence is contributing to the financial health of your company. This is your roadmap to prove it.
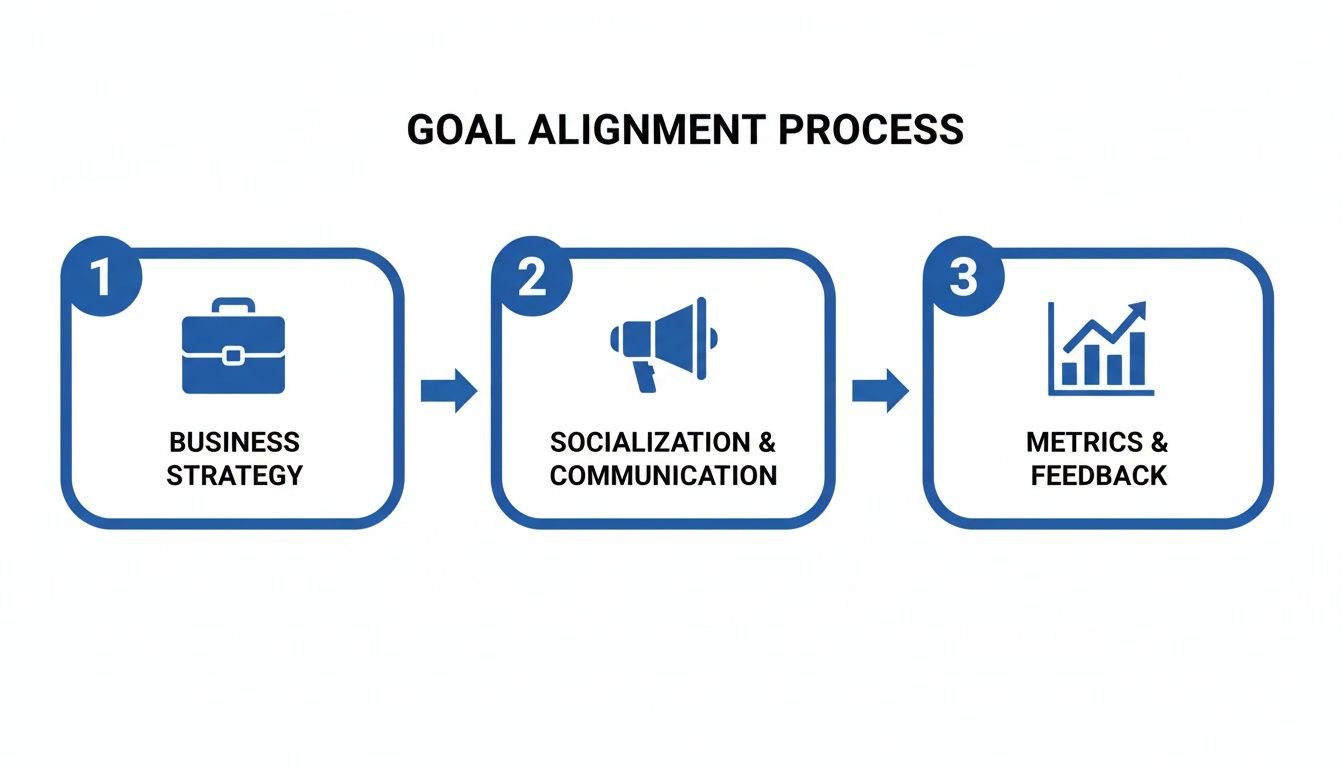
Aligning Social Media Goals with Business Outcomes
Before you can even begin to talk about social media ROI, you have to answer a fundamental question: what does “return” actually mean for your business? It’s so easy to fall into the trap of chasing vague goals like “building brand awareness” without ever tying that effort back to something that moves the needle.
So, let's start there. The most critical first step is to draw a direct line from your social media objectives to your overarching business goals. This is about shifting your mindset from just publishing content to driving real, measurable results.
Instead of a soft target like "growing our LinkedIn presence," you need something concrete. A much stronger, more accountable goal would be, "increase demo requests originating from LinkedIn by 25% this quarter." See the difference? One is an activity; the other is an outcome.
This kind of clarity forces you to distinguish between the metrics that feel good and the metrics that actually matter.
Leading Versus Lagging Indicators
Think of your metrics as clues in a detective story. Some clues hint at what's about to happen, while others tell you what already occurred.
- Leading Indicators are your forward-looking metrics. They're the early signs that you're on the right track. We're talking about things like post engagement rates, link clicks, and follower growth—signals that you’re capturing attention from an audience that might convert down the road.
- Lagging Indicators are the backward-looking results. These are your bottom-line numbers that can't be argued with: customer acquisition cost (CAC), revenue generated from social leads, and customer lifetime value (LTV).
A smart strategy keeps an eye on both. A spike in engagement (a leading indicator) is great, but if it never leads to a lower acquisition cost (a lagging indicator), something in your strategy is broken.
The real magic happens when you can prove a direct connection between your leading and lagging indicators. For instance, if you can show that a 10% increase in LinkedIn post clicks consistently results in a 5% increase in qualified leads, you've just found a predictable lever for growth.
A Practical Framework for Goal Setting
To make this connection real, your goals have to be specific and actionable. General objectives only lead to generic activities with fuzzy, immeasurable results.
Here’s a quick look at how a B2B consultancy might map their high-level business needs to specific social media KPIs. This simple exercise ensures every post, every comment, and every campaign has a clear purpose.
Mapping Business Goals to Social Media KPIs
| Business Objective | Relevant Social Media Goal | Primary KPI to Track | Example Metric |
|---|---|---|---|
| Increase Sales Pipeline | Generate qualified leads from LinkedIn content | Number of MQLs from Social | 25 eBook downloads per month |
| Boost Brand Authority | Become a recognized voice in the industry | Share of Voice (Mentions) | 15% increase in brand mentions |
| Improve Customer Retention | Foster a loyal community and provide value | Engagement on Key Posts | 50+ comments on weekly tip posts |
| Reduce Hiring Costs | Attract top talent through company culture posts | Applications from Social | 10 qualified job applicants |
This kind of structured thinking is what separates the pros from the amateurs. When every piece of content serves a distinct business need, you stop wasting time and start seeing results.
The effort is well worth it. Industry data suggests that social media marketing is on track to deliver an average ROI of $5.20 for every dollar spent by 2026. Yet, a staggering 70% of marketers admit they struggle to measure organic ROI effectively, which is precisely why having a clear framework is so essential.
Ultimately, getting this alignment right from the start is the foundation for everything else. It dictates which KPIs you track, how you set up your analytics, and how you build reports that actually prove your value. To go deeper on connecting your efforts to tangible business impact, check out these 7 Proven Strategies to Improve Marketing ROI.
Getting Your ROI Tracking System Dialed In
You can't measure what you don't track. It's that simple. Without a solid data foundation, calculating your social media ROI is just a guessing game. This section is all about building that foundation—the pipes and wiring that connect your social media activity directly to real business results.
The whole point is to move beyond seeing a spike in website traffic and assuming it came from your latest LinkedIn campaign. We want to know, with certainty, that a specific post or ad drove a specific action. That requires a few key pieces of tech working together.
This alignment is critical. It makes sure every piece of data you collect actually helps prove the financial impact of your social strategy.
Use UTMs to Get Crystal Clear on Attribution
The single most important tool in your tracking toolkit is the UTM parameter. Think of UTMs as little "digital breadcrumbs" you tack onto the end of your URLs. They tell your analytics platform exactly where a visitor came from, allowing you to trace traffic back to its source with surgical precision.
Without them, your Google Analytics report might just show "linkedin.com" as a generic traffic source. But was that from an organic post or a paid ad? Was it from a link in the main feed or one you dropped in a comment? UTMs give you the answers.
A standard UTM-tagged URL can have five parameters, but for social media, these three are your workhorses:
utm_source: This identifies the platform (e.g.,linkedin,facebook).utm_medium: This specifies the channel (e.g.,social,cpc,email).utm_campaign: This names the specific campaign you're running (e.g.,q3_ebook_launch).
So, if you're promoting a new ebook on LinkedIn, the link in your post might look something like this: yourwebsite.com/ebook?utm_source=linkedin&utm_medium=social&utm_campaign=ebook_launch_sep23
When someone clicks that link, Google Analytics knows their entire visit came from your September ebook launch campaign on LinkedIn. Getting a handle on platform-specific tags like Facebook UTM parameters is a simple but incredibly powerful way to see what's really working.
Put Tracking Pixels and Conversion Events to Work
While UTMs tell you where people came from, tracking pixels tell you what they do once they hit your site. These are tiny snippets of code you install on your website that connect a user's behavior back to the social platform they came from.
The LinkedIn Insight Tag is a classic example. Once you've got it on your site, it lets you track conversions, retarget people who visited your site with ads, and see some really useful demographic data about your audience. It’s the bridge between what happens on LinkedIn and what happens on your website.
After the pixel is in place, you need to define your conversion events. These are the valuable actions you want people to take.
A conversion isn't always a final sale. It could be any step that moves someone down your funnel, like downloading a whitepaper, signing up for a webinar, or booking a demo. Each of these "micro-conversions" has a value that ladders up to your total ROI.
Tying It All Together: A Real-World Tracking Scenario
Let's walk through how this works in practice. Say you're a B2B consultant promoting a new case study on LinkedIn.
- The Post: You share a post with a snappy summary and a link to the landing page. That link is tagged with your UTMs:
utm_source=linkedin,utm_medium=social, andutm_campaign=acme_casestudy. - The Click: A potential client clicks the link. Right away, Google Analytics logs a new session from your "acme_casestudy" campaign.
- The Landing Page: The user hits your download page. Since you have the LinkedIn Insight Tag installed, LinkedIn also records this visit.
- The Conversion: They fill out the form to get the case study. You've already configured this form submission as a "Lead" conversion event in Google Analytics and as a matched conversion in LinkedIn Ads.
Boom. You have a complete data trail. You can now say with 100% confidence that your LinkedIn case study campaign generated a new lead. When you apply this rigor across all your social activities, you build a powerful data engine that makes calculating ROI straightforward and easy to defend. If you're looking to get more out of the data you're collecting, our guide on how to analyze content performance is a great next step.
The Practical Math of Social Media ROI
You've done the hard work of setting up your tracking infrastructure. Now comes the satisfying part: actually running the numbers and figuring out your social media ROI. This isn't about getting lost in complex financial models; it’s about applying a simple, powerful formula to the clean data you’ve gathered. The whole point is to translate your social media efforts into a clear, defensible number that proves its value.

At its heart, the formula for social media ROI is refreshingly straightforward:
ROI = (Revenue - Investment) / Investment * 100
This gives you a simple percentage. A positive number means you're making a profit; a negative one shows you’re in the red. It's a clear indicator of whether your efforts are paying off.
What's Your Total Investment?
Here's where a lot of marketers get it wrong. They only count ad spend as their "investment." To get a true picture of your ROI, you have to account for every single resource that goes into your social media strategy. This means tallying up all costs, both direct and indirect.
Think about a B2B consultant running their own LinkedIn presence. Just because they aren't running ads doesn't mean their investment is zero. Far from it.
- Tool Subscriptions: What’s the monthly cost for scheduling tools like Postiv AI, analytics software, or other social media management software for small business?
- Content Creation Costs: Did you pay a freelance writer, designer, or video editor? That all goes in the pot.
- Ad Spend: Of course, include the direct cost of any paid promotion on LinkedIn, Facebook, or elsewhere. If you run LinkedIn campaigns, use the benchmarks in our LinkedIn advertising costs guide to sanity-check what you should be paying.
- The Cost of Your Time: This is the big one everyone forgets. If you spend 10 hours a month on LinkedIn and your time is worth $150/hour, that's a $1,500 investment. You have to include it.
Adding these up gives you the "I" in your ROI equation. Without this complete picture, your ROI will be artificially high and, frankly, misleading.
How to Calculate Your Return
The "R" in ROI is your Return—the total value generated from your investment. For B2B businesses especially, this often goes way beyond immediate sales. You have to get smart about assigning value to leads.
Let's stick with our B2B consultant. A single LinkedIn post of theirs generates 10 downloads of an industry whitepaper. To find the return, we need to put a realistic dollar value on those leads.
Here’s how they might break it down:
- Lead to MQL Rate: Looking at past data, they know that 20% of people who download a whitepaper become Marketing Qualified Leads (MQLs). So, 10 downloads translates to 2 MQLs.
- MQL to Customer Rate: They also know that 1 in 4 MQLs eventually signs on as a paying client. This means those 2 MQLs are worth 0.5 new clients.
- Customer Lifetime Value (LTV): The average client is worth $10,000 over their lifetime.
By multiplying these figures (0.5 clients * $10,000 LTV), the consultant can confidently say those 10 downloads generated $5,000 in potential lifetime value. This becomes the "Revenue" part of the formula. It's a much more insightful approach than just counting downloads and mirrors the way you’d go about measuring content marketing ROI in a broader sense.
The key is to be consistent and ground your lead values in real historical data. Your assumptions have to be realistic and defensible. If you pull a huge lead value out of thin air, you'll undermine the credibility of your entire ROI calculation.
A B2B LinkedIn Example: Putting It All Together
Okay, let's calculate the final ROI for our consultant's campaign.
- Investment: $1,500 (time) + $100 (tools) = $1,600
- Return (Revenue): $5,000 (pipeline value)
Now, we just plug these numbers into the formula: ROI = ($5,000 - $1,600) / $1,600 * 100 = 212.5%
A 212.5% ROI is a powerful statement. It proves that for every dollar they put into their LinkedIn activities, they're generating $2.13 in return.
While one recent survey found Facebook often delivers the highest B2B ROI, the math stays the same no matter the platform. You can find more on Statista.com. Proving this value is critical, especially when 65% of marketers still feel uncertain about it. This kind of concrete evidence is what transforms social media from a "nice-to-have" channel into a proven business driver.
Visualizing and Reporting Your ROI Story
You've done the heavy lifting—all the tracking is in place, the campaigns have run, and you've crunched the numbers. But what you're left with is just that: numbers. Raw data, sitting in a spreadsheet, doesn't tell a story. To really prove the value of your social media program, you need to turn that data into a compelling narrative that your CEO or your marketing team can immediately grasp.

This is where smart reporting and visualization come into play. A great dashboard does more than just display metrics; it surfaces insights and helps you make better strategic decisions. It's about moving from a spreadsheet full of figures to a clear story that proves your impact.
Building Your First ROI Dashboard
You don't need to break the bank on a sophisticated business intelligence platform to get started. Honestly, a free tool like Google Looker Studio (what used to be called Data Studio) is more than powerful enough to build a dashboard that highlights what truly matters. The trick is to properly connect your data sources—think Google Analytics 4, LinkedIn Ads, and your CRM—and focus on telling a visual story.
Your dashboard should be built to answer crucial questions at a glance. Instead of just listing numbers, use charts to show trends and connections.
A solid, straightforward social media ROI dashboard should probably include:
- A big-picture ROI scorecard: Put your overall ROI percentage front and center, big and bold. No one should have to hunt for it.
- Investment vs. Return trend line: A simple line graph plotting your total investment against the revenue or pipeline value it generated over time. It’s the easiest way to see when your efforts are really starting to pay off.
- Conversions by Social Channel: A bar chart is perfect for this. It quickly shows which platforms, like LinkedIn or Facebook, are actually driving the most valuable actions.
- Top-Performing Content: I like to include a simple table here. List your most successful posts and, if you can, tie them directly to the leads or revenue they generated.
The whole point is to create a single source of truth. Anyone in the company should be able to look at it and instantly understand the financial impact of your social media strategy.
Tailoring Your Report for Different Audiences
One of the biggest reporting mistakes I see marketers make is creating a single, one-size-fits-all report. It just doesn't work. Your CEO cares about a completely different set of metrics than your social media manager does, and your reports have to reflect that.
What Your CEO Needs to See
Your leadership team is focused on the bottom line. Period. They need a high-level summary that connects your social media activity directly to the company's financial goals.
They're looking for answers to questions like:
- Overall ROI: The big one. For every dollar we put in, how many did we get back?
- Customer Acquisition Cost (CAC) from Social: How much does it cost us to acquire a new customer through these channels? Is it efficient?
- Revenue and Pipeline Contribution: What’s the total dollar value social media has added to our sales pipeline this quarter?
- Key Trends Over Time: Are we improving? Show me a simple quarter-over-quarter comparison.
Your report to the C-suite has to be concise and focused on outcomes, not activities. They don’t need the engagement rate on a specific LinkedIn post; they need to know if the entire social media program is a profitable investment for the business.
What Your Marketing Team Needs to See
Your marketing team, on the other hand, lives in the details. Their report needs to be a diagnostic tool that helps them figure out what’s working, what isn’t, and why. This is where you get granular.
This in-the-weeds report should include:
- Campaign-Level ROI: Which specific campaigns are driving the best return?
- Conversion Rates by Content Type: On LinkedIn, are carousels actually generating more demo requests than single-image posts?
- Audience Performance: Are we seeing better results from marketing managers at mid-market tech companies?
- Attribution Data: Let's see the first-touch vs. multi-touch attribution breakdown to understand the whole customer journey.
This level of detail empowers your team to make smart, data-driven decisions. They can double down on what works, kill underperforming campaigns quickly, and constantly refine their approach to boost the overall ROI. By creating these two distinct reports, you make sure everyone gets exactly the information they need to do their job, turning your ROI data from a bunch of numbers into a powerful engine for growth.
Troubleshooting Common ROI Pitfalls
So, you've meticulously set up your tracking, your dashboards are live, and… the numbers are a bit underwhelming. It happens to everyone. Don't panic. This isn't a failure; it's a diagnostic opportunity. When the data doesn't tell the story you expected, it's time to put on your detective hat and figure out why.
One of the most common puzzles I see is a campaign with sky-high engagement—tons of likes, comments, and shares—but a flatline on actual conversions. Your audience clearly loves the content, but that enthusiasm isn't turning into demo requests, sign-ups, or sales. This is a classic sign that the problem isn't on social media; it's what happens after the click.
Diagnosing the Post-Click Experience
When you have great engagement but poor conversions, your landing page is the first place to look. Think of your social post as a promise. Does your landing page deliver on that promise instantly and clearly? If someone clicks a post about a "free social media ROI template" and lands on a generic homepage, you've created a jarring disconnect. That friction is a conversion killer.
The same goes for the user experience on the page itself. An overly long form or a vague call-to-action (CTA) can stop a motivated prospect in their tracks. Your job is to make saying "yes" as easy as possible.
Run through this quick checklist to see where the friction might be:
- Message Match: Is the headline on your landing page a near-perfect mirror of your social post's hook?
- Form Friction: Are you asking for their life story? Every single field you can remove will likely boost your conversion rate.
- CTA Clarity: Is there one, obvious, compelling button to click? Avoid giving users too many choices.
- Load Speed: We've all been there. If the page doesn't load in under 3 seconds, a significant number of people will just leave.
The Flawed Attribution Model Trap
Another huge, and often hidden, reason for poor ROI figures is a faulty attribution model. If you're only looking at last-touch attribution, you’re only seeing the final step in a customer's long journey. This model gives 100% of the credit to the very last thing a person clicked before converting.
This is a massive blind spot. Social media often plays a critical role at the beginning of the journey, introducing your brand and building trust over time. A customer might see your LinkedIn post, forget about it, see a Google Ad a week later, and then finally convert from an email newsletter. Last-touch gives all the credit to the email, making your social efforts look worthless. It's a fundamentally flawed way to view a complex process.
By switching to a multi-touch attribution model, you get a much more realistic view of what’s actually working. It distributes credit across the various touchpoints that influenced the final decision, properly valuing the crucial role social media plays in warming up your audience.
Dive into your analytics platform—whether it's Google Analytics or a more advanced tool—and explore models like linear, time-decay, or position-based. Finding the right model helps you justify the investment in channels that build the pipeline, not just close the deal. Refining how you measure social media ROI is a continuous cycle of testing, learning, and optimizing every piece of the puzzle.
Got Questions About Social Media ROI? We've Got Answers.
Even with a great framework in place, you're bound to run into some tricky questions when you get down to the nitty-gritty of measuring social media ROI. Let's tackle some of the most common ones I hear from clients and colleagues.
How on Earth Do I Measure ROI for Organic Social Media?
This is the big one. Without direct ad spend, it feels a bit like trying to catch smoke. But you can absolutely do it—the trick is to assign a dollar value to outcomes that aren't direct sales.
Your main investment here isn't ad dollars; it's the time your team spends creating content, engaging with followers, and managing the community. The return comes from tracking conversions that originate from your organic posts. You do this by getting meticulous with UTM parameters in your links. From there, you can assign a value to each lead you generate based on historical data. For instance, what's your average lead-to-customer conversion rate? What's the lifetime value of that customer? This is how you draw a straight line from that organic post to real revenue.
What's a "Good" Social Media ROI, Really?
Everyone wants a magic number, but the truth is, a "good" ROI is completely relative. A 3:1 return (meaning you make $3 for every $1 you put in) might be amazing for a B2B SaaS company with high margins, but it could be a total loss for an e-commerce store selling low-margin products.
Forget industry averages for a second. The most important benchmark is simply profitability. Is your social media ROI consistently positive after you account for all the costs, including salaries, software, and content creation? If the answer is yes, you're winning. The best practice is to stop comparing yourself to others and start benchmarking against your own past performance. Aim for steady improvement, month over month, quarter over quarter.
How Often Should I Be Calculating This Stuff?
For most businesses, a monthly and quarterly rhythm is the sweet spot.
- Monthly check-ins are perfect for your team on the ground. They allow you to make tactical shifts, see which campaigns are hitting (or missing) the mark, and reallocate your budget or effort where it’s needed most.
- Quarterly reviews are for the bigger picture. This is when you step back and present the strategic impact to leadership, showing how social media is moving the needle on major business goals over time.
Resist the urge to obsess over daily ROI numbers. Social media is a long game. Its impact often builds over time, so give your strategy the space it needs to mature and deliver real results.
Ready to turn your LinkedIn efforts into measurable results? Postiv AI helps you create high-impact content, from compelling posts to stunning carousels, in a fraction of the time. Stop guessing and start growing. Discover how Postiv AI can elevate your strategy.