In a sea of text-only updates, visually compelling infographics and carousels are your secret weapon for stopping the scroll on LinkedIn. They break down complex ideas, showcase expertise, and drive engagement far more effectively than a simple status update. But creating them from scratch can be a significant time sink, demanding design skills and juggling multiple, often disconnected, tools.
That's where a dedicated LinkedIn infographic maker comes in. These platforms are built to streamline the entire content creation workflow, from initial ideation and AI-powered writing to professional design and direct scheduling. They solve the core problem of producing high-quality, on-brand visual assets consistently without the typical friction or high cost of a graphic designer.
This guide dives deep into the top 12 tools available today. We’ll move beyond generic feature lists to provide a practical comparison of each platform’s capabilities, including AI features, carousel export options, template quality, and team collaboration tools. For each option, you’ll find direct links and screenshots to help you quickly identify the best solution for your specific needs, whether you’re a solopreneur, a marketing manager, or an agency managing multiple clients. Our goal is to help you find the perfect fit to elevate your content strategy and build authority.
Free LinkedIn Infographic Maker Options (2026)
Most readers searching for a LinkedIn infographic maker are checking whether they can ship a carousel without paying. The answer is yes, with caveats. Here is the short list of genuinely free options, ranked by what they actually let you export on the free tier:
- DocHipo (free, no watermark). The most generous free tier in the category. You get LinkedIn carousel templates and a watermark-free PDF download, which is the format LinkedIn requires. Best free pick if you only need a clean PDF.
- Canva (free, PDF export). The largest template library in the space, and the free plan exports PDF without a watermark. Premium templates and the Brand Kit sit behind the paid tier, but the free editor is more than enough for a single carousel.
- Piktochart (free, basic templates). Solid for data-driven infographics. The free plan lets you export PDF or PNG with the Piktochart logo on basic templates.
- Venngage (free, Venngage branding). Huge template library for business topics. The free plan adds Venngage branding to exports, which most LinkedIn posters consider a deal-breaker. Upgrade to remove it.
- Adobe Express (free, core editing). Generous starter assets and AI image generation on the free tier. Premium templates and full Adobe Stock access require a subscription.
If your bottleneck is design speed rather than budget, Postiv AI is not free but offers a $1 trial that lets you generate the AI copy, design the carousel, and schedule the post in one workflow. Most users find the trial pays for itself by saving the hour of context-switching between ChatGPT, Canva, and a separate scheduler.
Free plan trade-off to know: Free tiers almost always limit export quality, lock the brand kit, or watermark the file. For one-off LinkedIn carousels that is fine. If you post weekly, the time you spend recreating brand styles slide by slide costs more than a paid plan.
AI LinkedIn Infographic Generator: How It Works in 2026
An AI LinkedIn infographic generator is the fastest-growing subcategory of these tools. Instead of choosing a blank template, you give the AI a prompt or a piece of source content and it returns a designed infographic. Three flavors exist:
- Prompt-to-image generators (Gemini Nano Banana, ChatGPT image tool, Lovart). Best for single-slide stat highlights. Less reliable for multi-slide carousels because each generation drifts in typography and color.
- Prompt-to-template generators (Venngage AI, Piktochart AI). The AI picks a template and fills it with your text. You still tweak inside the editor. Strong middle ground.
- End-to-end AI carousel makers (Postiv AI). The AI writes the copy, designs each slide with a shared brand kit, and exports a LinkedIn-ready PDF. Best for repeatable weekly posting because the system enforces consistency across slides automatically.
The right tool depends on volume. If you ship one infographic per quarter, a prompt-to-image tool plus Canva is enough. If LinkedIn is a core distribution channel, an end-to-end AI carousel maker removes the friction of stitching together three apps.
The Gemini Nano Banana Prompt for LinkedIn Infographics
Gemini's Nano Banana image model is currently the leading prompt-only path to a LinkedIn infographic. Copy this prompt template and replace the bracketed fields:
Create a 1080 x 1350 px portrait infographic titled [TOPIC].
Use [N] numbered sections in a clean minimal style.
Background: [HEX or color name].
Accent color: [HEX or color name].
Typography: sans-serif, bold headers, regular body.
Include these data points: [DATA].
Leave a 120 px margin in the bottom-right corner for a brand logo.
Style reference: [paste a URL or upload an image].
Run the prompt once, screenshot the result if you like it, then re-run with "keep the same style, fonts, and colors" plus the next slide's data. This is how you get multi-slide consistency from a prompt-only tool. For full LinkedIn carousels, paste the slide outputs into a PDF assembler or use a dedicated LinkedIn carousel maker that imports images and exports a single PDF.
How to Create a LinkedIn Infographic in 5 Steps
Before diving into the tools, here’s the general workflow for creating an infographic that performs well on LinkedIn:
- Choose your format. Decide between a single-image infographic (1080 x 1080 px or 1080 x 1350 px) and a multi-slide infographic carousel (PDF with slides at 1080 x 1350 px). Carousels generate more dwell time because each swipe signals engagement to the algorithm. For a deep dive into the carousel format, see our complete LinkedIn carousel guide.
- Outline your data story. Start with one clear takeaway. Whether you’re presenting statistics, a step-by-step process, or a comparison, your infographic needs a single thesis that the visuals support. Following proven LinkedIn carousel best practices will help you structure slides that hold attention.
- Pick an infographic maker. Use any of the 12 tools reviewed below. If speed matters most, choose an AI-powered option that generates layouts from your text. If design control matters most, choose a template-based editor like Canva or Adobe Express.
- Design with your brand. Apply your brand colors, fonts, and logo. Consistency across posts builds recognition in the feed, which compounds engagement over time.
- Export and post. Export as a PDF for carousel uploads or as a high-resolution PNG for single-image posts. Write a compelling caption that introduces the infographic’s key insight and includes a clear call to action.
Now let’s look at the best LinkedIn infographic maker tools available in 2026, starting with all-in-one platforms and moving through specialized design tools and template marketplaces.
7 Types of LinkedIn Infographics That Drive Engagement
Not all infographics perform equally on LinkedIn. The format you choose should match your message. Here are the seven main infographic types and when to use each one:
1. Statistical Infographics
These highlight numbers, percentages, and data points with charts, graphs, and bold typography. They perform exceptionally well on LinkedIn because professionals love shareable data. Example: "SaaS churn benchmarks by industry in 2026."
2. Informational Infographics
Overview-style visuals that explain a topic with sections, icons, and short text blocks. Ideal for thought leadership posts that introduce a framework or summarize a complex subject in one image.
3. Timeline Infographics
Chronological layouts that show milestones, company history, or market evolution. These work well for growth stories, product launch retrospectives, and industry trend recaps.
4. Process Infographics
Step-by-step flows that guide the reader through a workflow, onboarding sequence, or decision tree. These are some of the most saved infographic types on LinkedIn because they offer actionable, repeatable value.
5. Comparison Infographics
Side-by-side layouts that evaluate two or more options (tools, strategies, approaches). Comparison infographics drive high engagement because they help the reader make a decision, which naturally invites comments.
6. Geographic Infographics
Map-based visuals that display regional data, market expansion, or demographic breakdowns. These are niche but powerful for B2B companies with location-specific insights.
7. Hierarchical Infographics
Pyramid, flowchart, or org-chart layouts that show ranked structures, priority frameworks, or tiered systems. These work well for packaging thought leadership into a visual mental model.
For LinkedIn specifically, statistical, comparison, and process infographics consistently generate the most saves and shares. When designed as a carousel (PDF upload), each type benefits from the added dwell time that multi-slide formats create. For a broader comparison of carousel-first tools, see our roundup of the best LinkedIn carousel makers. Most of the tools reviewed below offer templates for all seven types.
1. Postiv AI
Postiv AI establishes itself as a premier, all-in-one content engine meticulously engineered for LinkedIn. It goes far beyond a simple LinkedIn infographic maker by integrating a brand-trained AI writer, a native carousel designer, smart scheduling, and performance analytics into a single, cohesive workflow. This end-to-end system is designed to eliminate the common friction points of content creation, from initial idea to published post, making it an exceptional choice for B2B founders, marketers, and agencies who prioritize efficiency and impact on the platform.
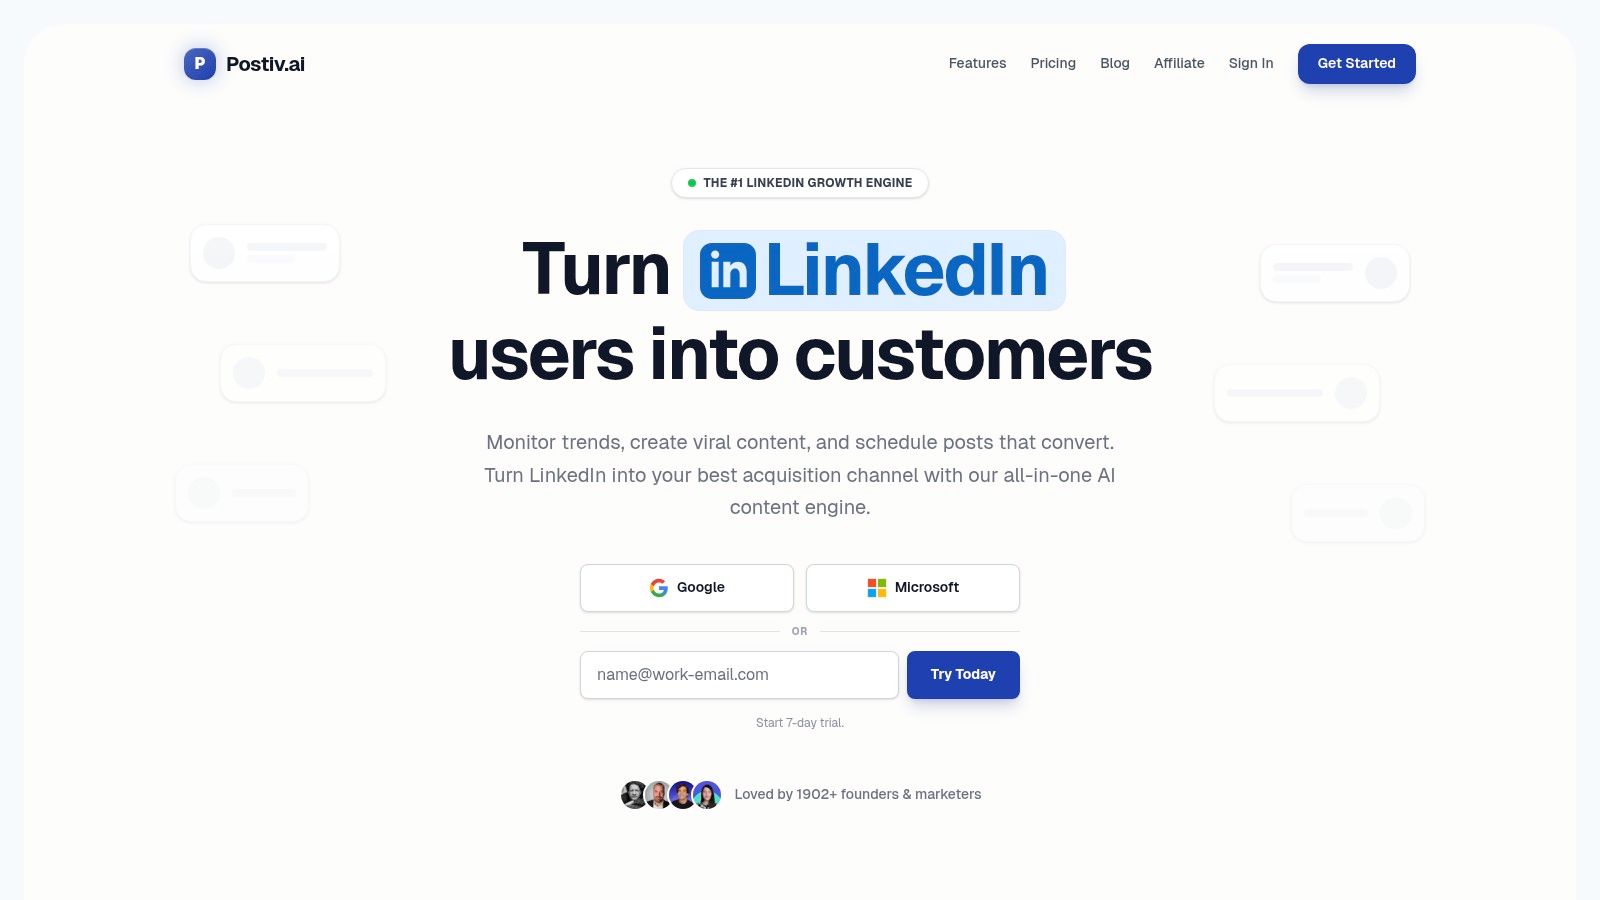
The platform’s core strength lies in its Knowledge Library feature. You can feed it your own proprietary content like PDFs, videos, Notion pages, or website links, training the AI to write in your authentic voice and leverage your unique expertise. This turns the AI from a generic writing assistant into a true content partner that reuses your best ideas, ensuring every carousel and post reflects your brand's authority. With design-ready templates and robust typography controls, you can produce visually polished carousels in minutes, not hours.
Key Features & Analysis
- End-to-End Workflow: The integration of an AI writer, carousel designer, scheduler, and analytics in one place saves significant time and removes the need for multiple subscriptions.
- Brand-Trained AI: The ability to build a private knowledge library ensures content is original, on-brand, and consistently high-quality, repurposing your expertise effortlessly.
- Agency & Team-Ready: Features like content approvals, role-based access, and white-label reporting make it ideal for scaling content production across teams and clients.
- LinkedIn-First Design: Postiv focuses on LinkedIn-compliant scheduling (not risky automation), provides suggestions for optimal posting times, and offers PDF or image export for native-quality carousels.
| Feature | Availability |
|---|---|
| AI Content Writer | Yes (Trained on private Knowledge Library) |
| Carousel Designer | Yes (Integrated with templates) |
| Scheduler | Yes (LinkedIn-compliant, multi-profile) |
| Analytics | Yes (Tracks post performance and engagement) |
| Team Features | Yes (Approvals, roles, shared asset libraries) |
| Best For | Founders, B2B marketers, and agencies |
Pricing
- Pro: $99/month for single creators.
- Team: $229/month for 3 seats.
- Enterprise & Agency: Custom pricing available.
Postiv AI offers trial options, allowing users to test its powerful workflow before committing. Its structure is purpose-built for professionals who see LinkedIn as a critical channel for lead generation and brand authority.
2. Canva
Canva is a titan in the design space, making it a go-to choice for creating polished LinkedIn infographics and carousels, even for non-designers. Its massive template library provides a quick starting point, while the intuitive drag-and-drop editor allows for deep customization. The Brand Kit feature ensures every asset remains consistent with your company's visual identity.
A standout feature is the ability to export multi-page designs as a single PDF, which is the exact format needed for LinkedIn’s document carousel posts. You can create each slide of your carousel within one Canva project and export it ready for upload. For those running paid campaigns, the direct LinkedIn Ads app integration is a significant time-saver, allowing you to design and publish creatives straight to your ad account.
Key Features:
- Vast Template Library: Thousands of professionally designed templates for infographics and carousels.
- Brand Kit: Centralize your logos, color palettes, and fonts for brand consistency.
- Team Collaboration: Real-time commenting and approval workflows for teams.
- LinkedIn Ads Integration: Design and push ad creatives directly to a connected ad account.
Pricing:
- Free: Generous free plan with access to many templates and features.
- Pro: Starts at $119.99/year for one person, unlocking premium templates, Brand Kit, and Magic Resize.
- Teams: Starts at $300/year for a team of 5, adding advanced collaboration tools.
| Pros | Cons |
|---|---|
| Extremely user-friendly and familiar interface. | Advanced features are locked behind paid plans. |
| Streamlined PDF export for LinkedIn carousels. | Free plan has limitations on asset usage and brand tools. |
| Direct integration with LinkedIn Ads simplifies workflow. | Pricing for Teams can be a consideration for larger groups. |
Best For: Solo founders, marketing teams, and agencies who need a versatile and reliable LinkedIn infographic maker that combines ease of use with powerful collaboration and publishing features. If you're weighing Canva against more LinkedIn-focused alternatives, our Canva LinkedIn carousel alternative comparison explains the trade-offs. Remember to design using the correct LinkedIn graphic dimensions for optimal presentation.
3. Adobe Express
Adobe Express leverages Adobe's powerful creative suite in a simplified, browser-based editor, making it a strong contender for creating high-quality LinkedIn content. It offers a dedicated gallery of over 150 LinkedIn carousel templates and a free infographic maker, providing excellent starting points. Its integration of brand kits, generative AI assists, and easy resizing tools allows for quick, on-brand content creation.
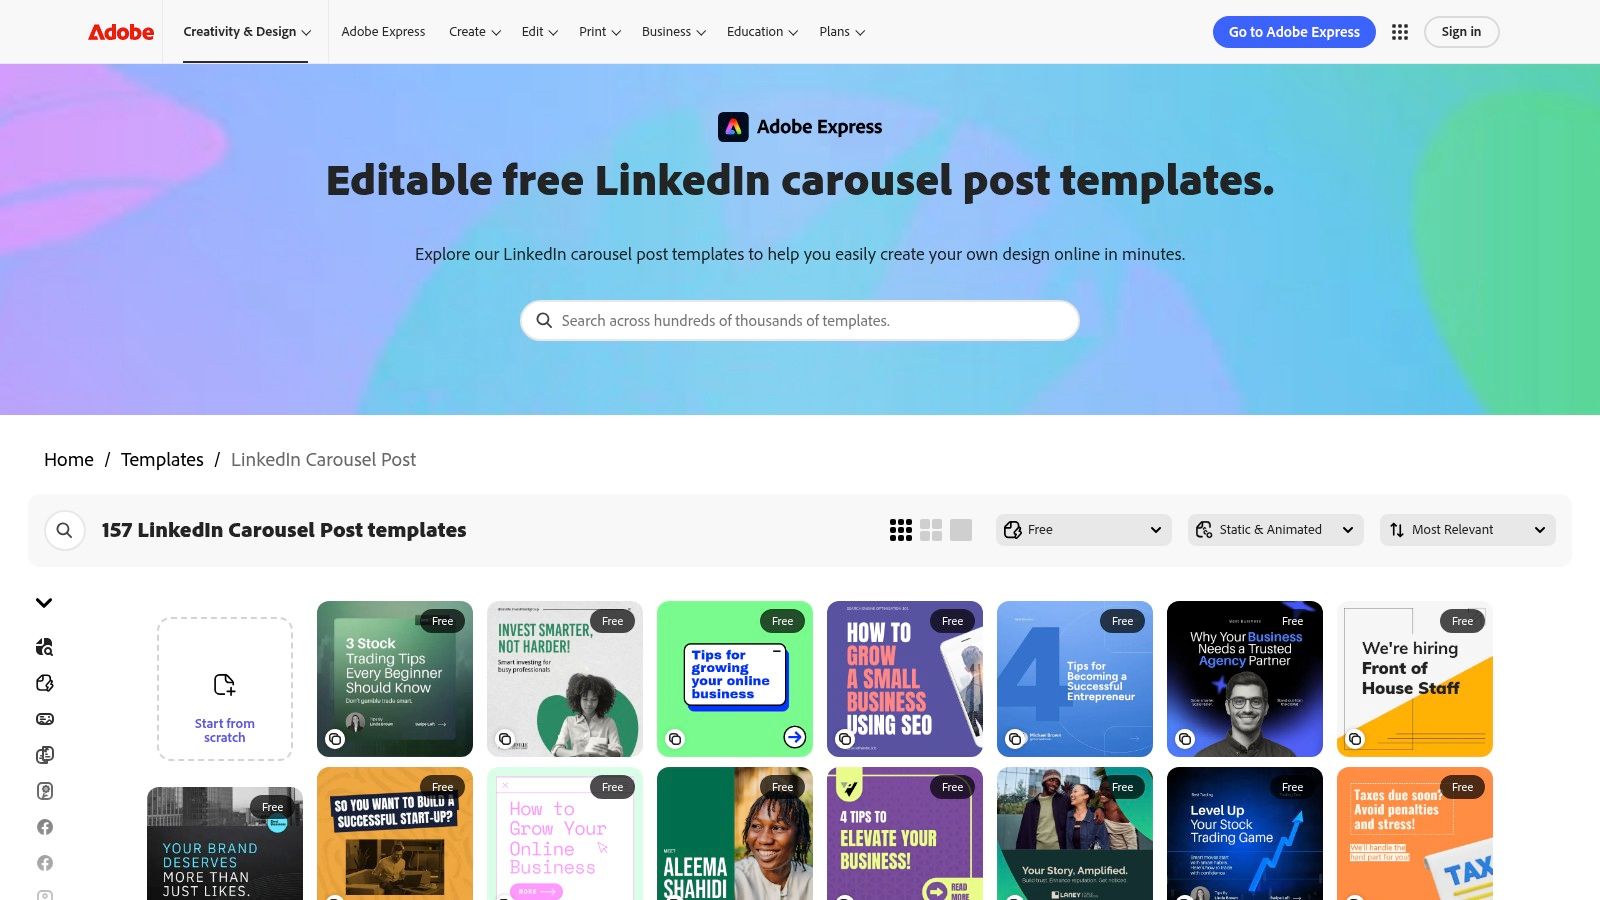
A key advantage is its seamless PDF export functionality, which is perfectly suited for uploading multi-page designs as LinkedIn document posts or carousels. The platform also connects directly to Adobe's ecosystem, including access to Adobe Fonts and Adobe Stock assets, giving users a vast library of professional resources. To maximize your impact, pair these powerful design tools with a solid understanding of content creation best practices that drive engagement.
Key Features:
- LinkedIn-Specific Templates: Hundreds of carousel and post templates designed specifically for LinkedIn.
- Brand Kit: Maintain consistency with centralized brand assets, fonts, and colors.
- Generative AI: Use AI to generate images and text effects to speed up the creative process.
- Adobe Ecosystem Integration: Access to a massive library of Adobe Fonts and Stock photos.
Pricing:
- Free: A robust free plan with access to core editing tools and a limited selection of templates and assets.
- Premium: Starts at $9.99/month, unlocking all premium templates, assets, generative AI credits, and advanced brand features.
| Pros | Cons |
|---|---|
| Strong template library specifically for LinkedIn carousels. | Advanced assets and features require a paid plan. |
| Streamlined PDF export suitable for LinkedIn document posts. | Some premium templates or features are behind the subscription. |
| Powerful integration with the broader Adobe creative ecosystem. | Interface can have a slightly steeper learning curve than Canva. |
Best For: Creative professionals, marketers, and small business owners who want a powerful LinkedIn infographic maker with robust design features and seamless integration with the Adobe suite.
4. Visme
Visme positions itself as a powerful design platform specifically for creating data-driven visuals, making it an excellent choice for crafting compelling LinkedIn infographics. It excels where others may fall short by offering a rich library of data visualization tools like charts, maps, and interactive data widgets. This allows users to transform complex information into engaging, easily digestible content perfect for a professional audience.
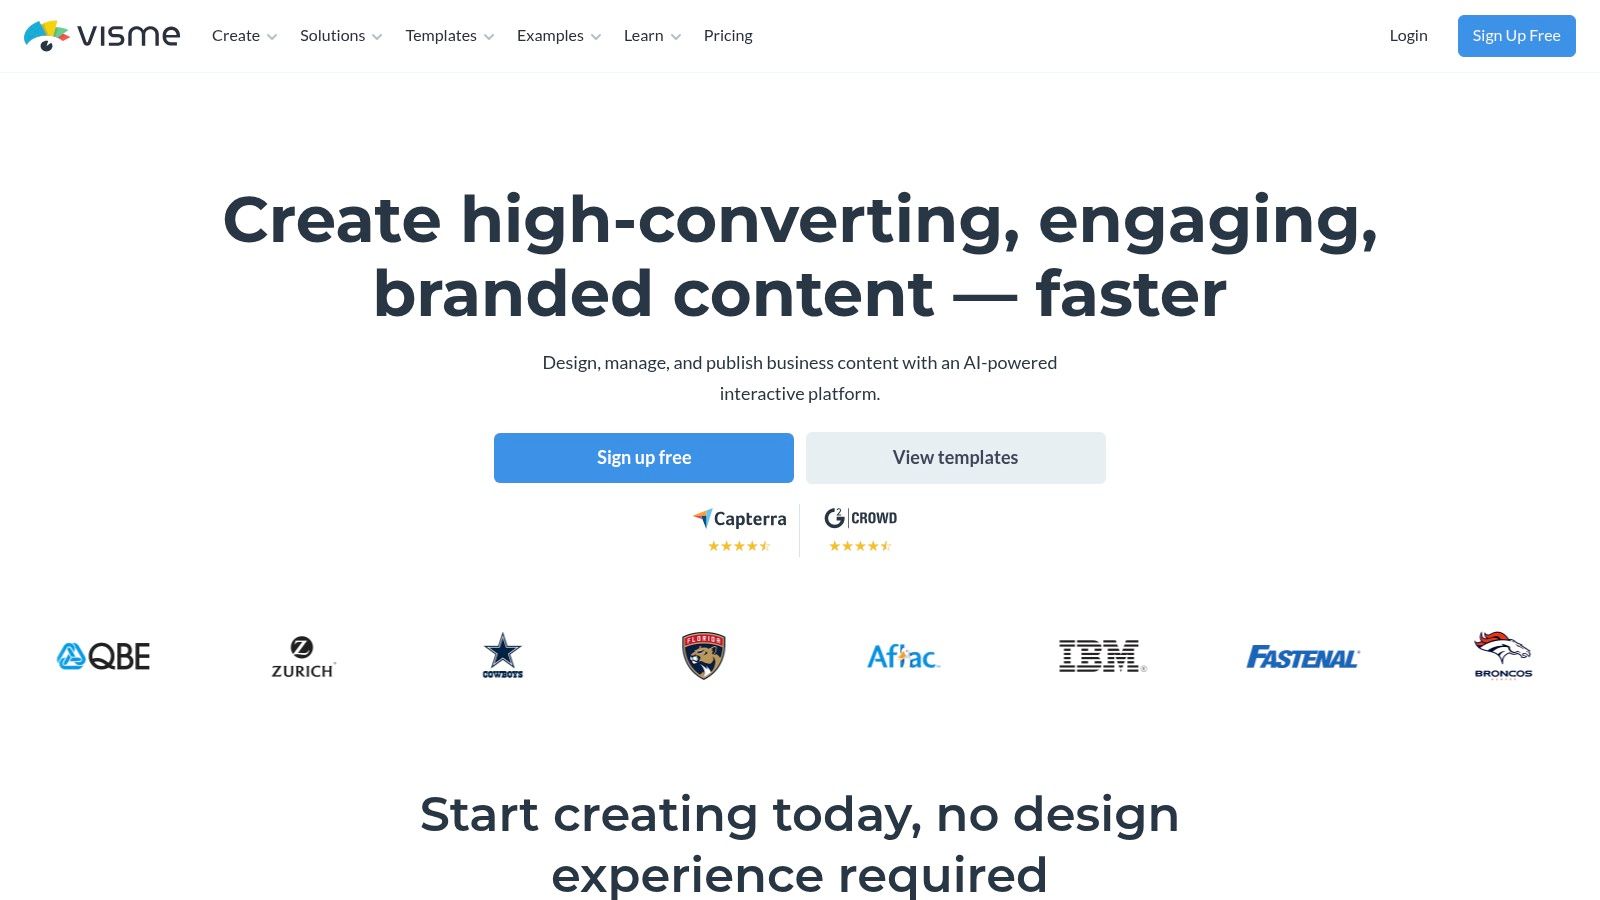
A key differentiator for Visme is its emphasis on interactivity and animation, which can bring static LinkedIn posts to life. While its more advanced features present a slightly steeper learning curve than simpler tools, the payoff is a higher level of customization and data representation. The platform provides specific LinkedIn post and infographic templates, and its multi-format export options, including PDF for carousels, ensure your creations are optimized for the platform.
Key Features:
- Data Visualization Tools: Extensive library of charts, graphs, maps, and interactive data widgets.
- Animation & Interactivity: Add motion and interactive elements to your designs.
- LinkedIn-Specific Templates: Ready-to-use templates for posts, infographics, and carousels.
- Multi-Format Export: Download assets as PDF, PNG, JPG, or even HTML5.
Pricing:
- Basic: Free plan with limited access to templates and features, includes Visme branding.
- Starter: Starts at $29/month, offering more templates and premium assets.
- Pro: Starts at $59/month, adding Brand Kit, analytics, and full download options.
| Pros | Cons |
|---|---|
| Excellent for creating data-heavy, branded visuals. | The feature set has a steeper learning curve than competitors. |
| Specialized templates for LinkedIn infographics and posts. | Key features and watermark-free downloads require a paid plan. |
| Strong animation and interactivity features. | Can be more expensive than other all-in-one design tools. |
Best For: B2B marketers, analysts, and consultants who need a LinkedIn infographic maker capable of transforming complex data and statistics into polished, professional visuals that command attention.
5. Venngage
Venngage is an infographic-first design platform that excels at helping professionals turn complex data and ideas into compelling visuals. Its strength lies in a vast library of over 10,000 templates, with granular categories tailored specifically to business topics like reports, timelines, and process flows, making it an excellent LinkedIn infographic maker for data-rich content.
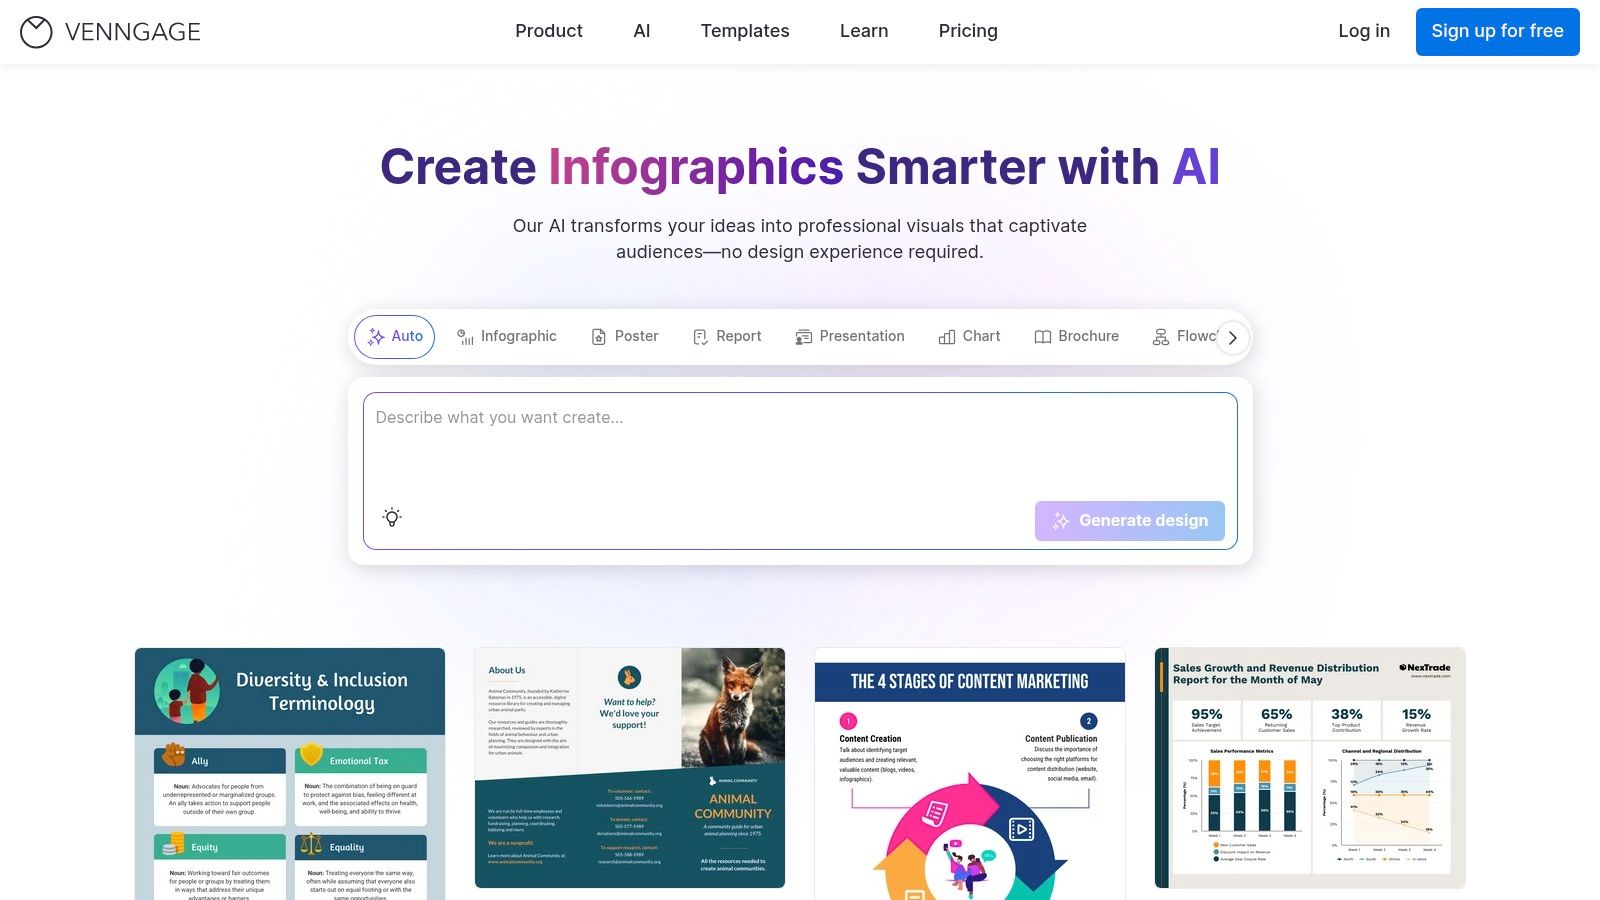
The platform is designed for speed, allowing non-designers to quickly select a relevant template and customize it with their own branding and information. AI-powered editing tools further streamline the creation process. While it's a powerful tool for single-page infographics, users can also create multi-page documents and export them as PDFs, making it a viable LinkedIn carousel generator. The focus on professional and corporate templates makes it particularly suitable for B2B marketers and consultants.
Key Features:
- Extensive Template Library: Over 10,000 templates with a strong focus on professional and business-centric infographics.
- AI-Powered Editing: Tools to assist in the design and content generation process.
- Multiple Export Formats: Download designs as PDF, PNG, or even PowerPoint files (plan-dependent).
- Business-Specific Categories: Find templates easily for reports, charts, mind maps, and more.
Pricing:
- Free: Limited access to templates and features with Venngage branding on exports.
- Premium: Starts at $19/month per user, unlocking premium templates and PNG/high-res PNG exports.
- Business: Starts at $49/month per user, adding team features, brand kit, and PDF/PowerPoint exports.
| Pros | Cons |
|---|---|
| Highly template-driven, enabling very fast creation. | Many professional templates are locked behind a paywall. |
| Deep library of infographic styles for professional topics. | Key export options like PDF are restricted to higher-tier plans. |
| User-friendly interface designed for non-designers. | Less versatile for general social media graphics than competitors. |
Best For: B2B marketers, consultants, and data analysts who need to quickly create professional, data-driven infographics for LinkedIn without extensive design experience.
6. Piktochart
Piktochart specializes in turning complex data into clear, compelling visuals, making it an excellent tool for creating data-driven LinkedIn infographics. It offers a variety of LinkedIn-specific templates, including headers and posts, ensuring your designs are correctly sized from the start. Its streamlined interface is built for speed, helping users generate professional reports, presentations, and social media graphics with minimal effort.
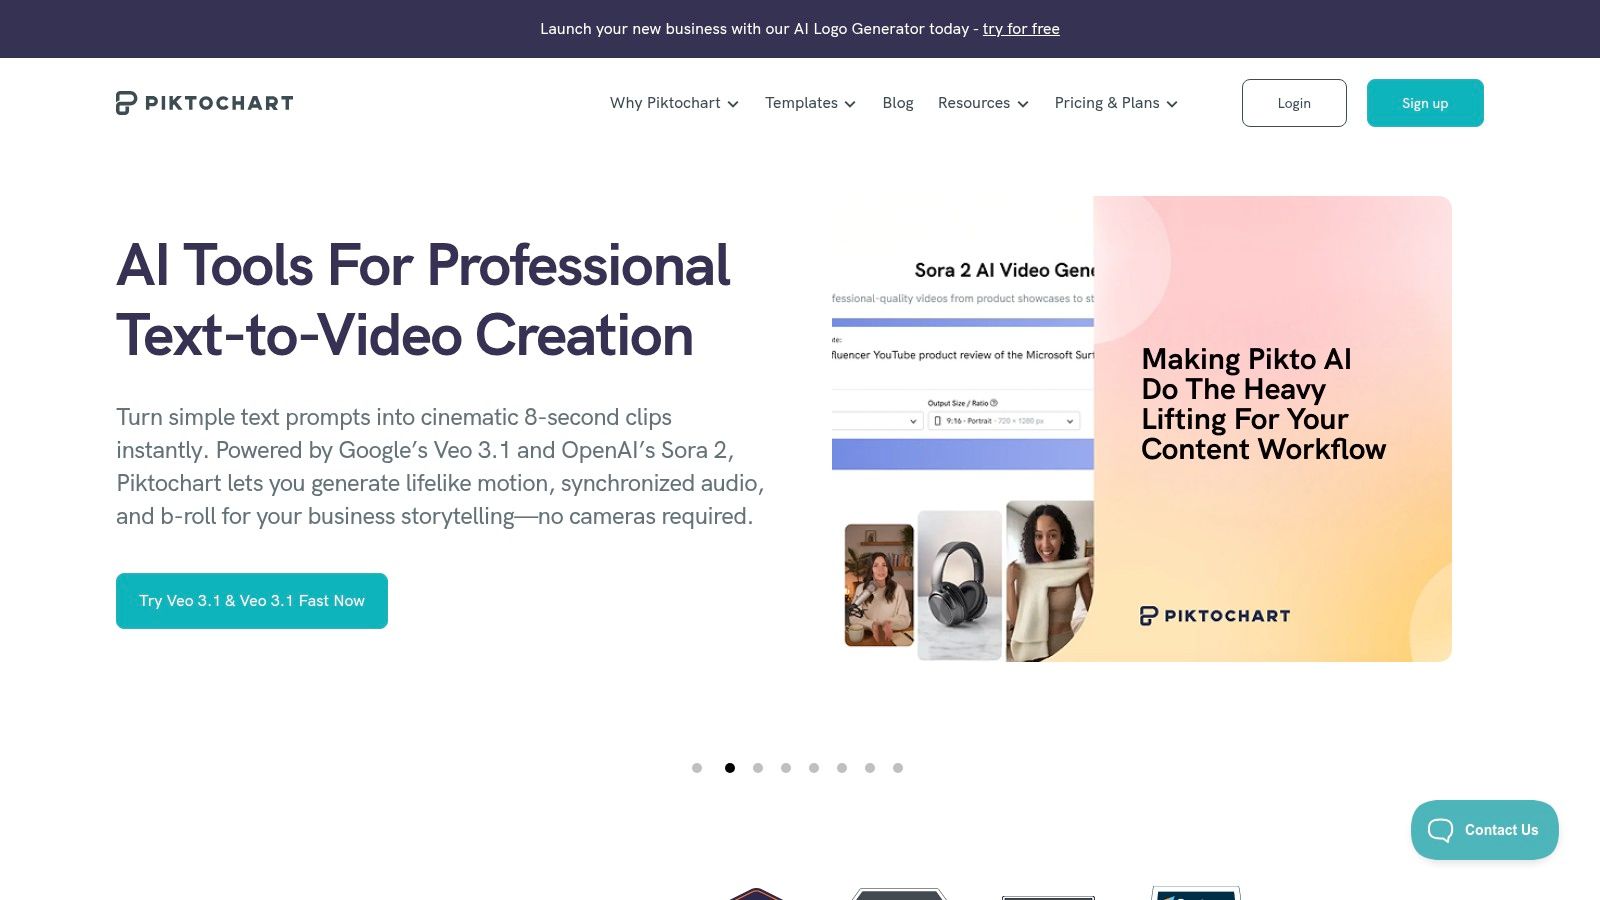
The platform’s strength lies in its infographic canvas and social media presets, which simplify the process of laying out statistics and key points. With its AI-assisted creation tools, you can quickly generate a first draft of an infographic by simply providing a text prompt. For LinkedIn carousels, you can design individual slides and export them as a multi-page PDF or separate PNG files, giving you the flexibility needed for document posts. This makes it a solid LinkedIn infographic maker for professionals focused on thought leadership through data.
Key Features:
- LinkedIn-Specific Templates: Pre-sized templates for LinkedIn headers, posts, and infographics.
- AI Infographic Generator: Creates visuals and layouts from simple text prompts to accelerate design.
- Data Visualization Tools: A wide range of charts, graphs, and maps for presenting statistics.
- Versatile Export Options: Download designs as PDF or PNG, suitable for LinkedIn document uploads.
Pricing:
- Free: Basic plan with access to a limited selection of templates and assets.
- Pro: Starts at $14/month per member (billed annually), unlocking all templates, brand assets, and advanced export options.
- Business: Starts at $24/month per member (billed annually), adding team collaboration features and personalized onboarding.
- Enterprise: Custom pricing for advanced security and management needs.
| Pros | Cons |
|---|---|
| Strong focus on data visualization and infographics. | Limited brand governance features compared to larger suites. |
| User-friendly interface with a gentle learning curve. | Advanced templates and features are behind the paywall. |
| AI generator provides a fast starting point for designs. | Free plan has noticeable watermarks and limitations. |
Best For: Data analysts, consultants, and marketers who frequently need to transform statistics and complex information into easily digestible infographics for their LinkedIn audience.
7. Kapwing
Kapwing is an accessible online editor that shines with its extensive library of templates, making it a strong contender for creating quick and effective LinkedIn content. While often known for video, its thousands of LinkedIn post templates are easily adapted into static infographics or can be used as individual pages for a carousel. The platform is entirely browser-based, supporting collaborative editing and straightforward asset uploads for a frictionless design process.
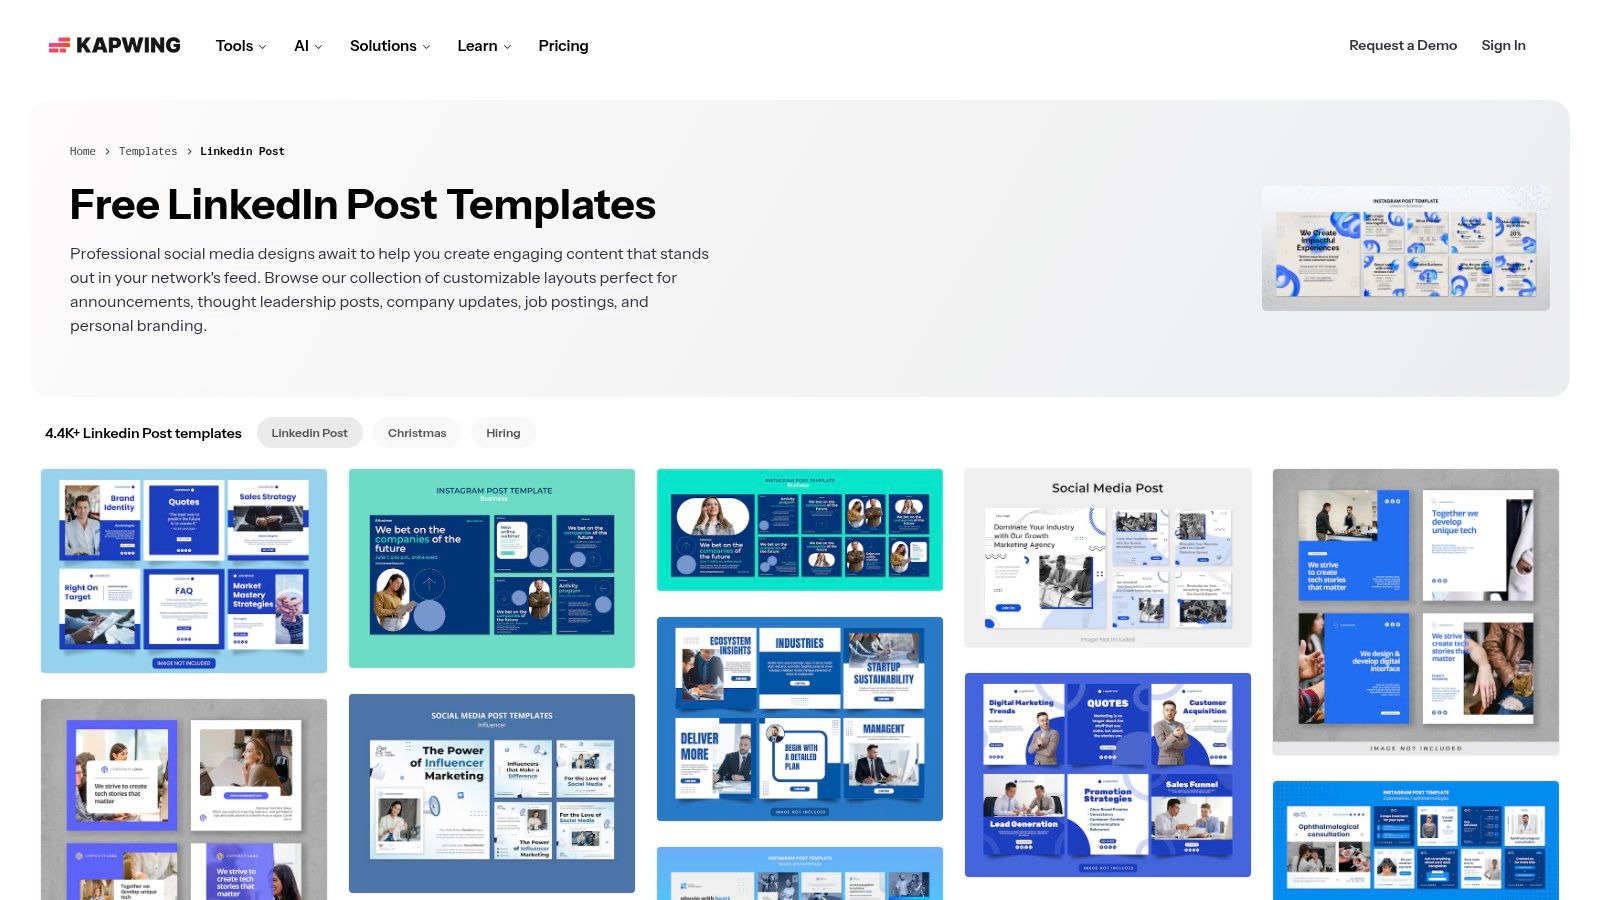
A key advantage of Kapwing is its simplicity and speed. Users can find a relevant template, customize it with their branding and data, and export it in minutes. While it doesn't have a direct "export as PDF carousel" function, you can create each slide as a separate project or scene and then assemble them into a PDF using another tool. Its resizing tools are also helpful for quickly adapting a single design to fit optimal LinkedIn dimensions.
Key Features:
- Massive Template Library: Over 4,400 LinkedIn post templates provide a vast and searchable starting point.
- Browser-Based Collaboration: Work with team members in real-time directly in your web browser.
- Easy Asset Management: Simple uploads for logos, images, and other brand assets.
- Flexible Export Options: Export high-quality images that can be assembled into a carousel PDF.
Pricing:
- Free: Watermarked exports, file size limits, and access to some free tools.
- Pro: Starts at $24/month per user, offering no watermarks, higher quality exports, and premium features.
- For Teams: Custom pricing for larger teams needing centralized billing and admin controls.
| Pros | Cons |
|---|---|
| Huge, searchable library of LinkedIn post templates. | Best for static designs; advanced branding tools are limited. |
| Very low learning curve for fast content creation. | Premium features and watermark removal require a subscription. |
| Collaborative features are built-in and easy to use. | Lacks a direct PDF export feature for multi-page carousels. |
Best For: Solopreneurs, content creators, and small marketing teams who need a fast and easy-to-use LinkedIn infographic maker for creating individual posts and static graphics without a steep learning curve. Find out more at https://www.kapwing.com/templates/linkedin-post.
8. Snappa
Snappa positions itself as a streamlined, rapid-fire design tool, making it an excellent choice for marketers who need to produce on-brand LinkedIn graphics quickly. It strips away the complexity of more robust platforms, offering a simple, fast drag-and-drop editor focused on speed. Its library includes correctly sized LinkedIn post and banner templates, along with a dedicated infographic canvas to get you started without delay.
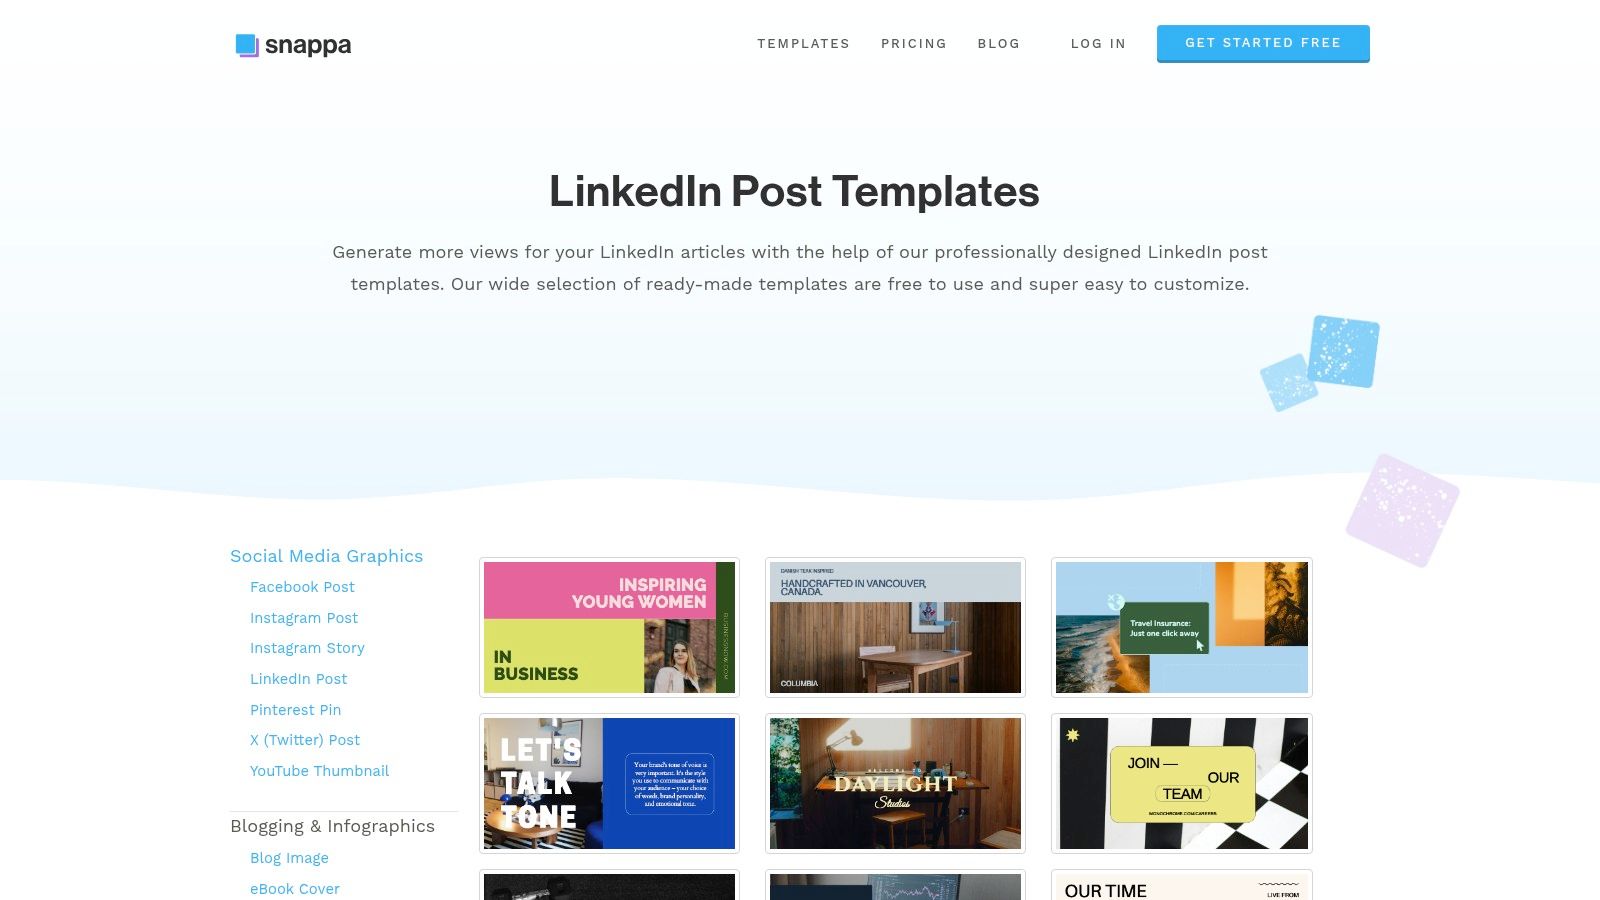
While Snappa doesn't export multi-page PDFs directly, its workflow is optimized for carousel creation. Users can quickly design individual infographic slides and export them as high-resolution images. These images can then be easily assembled into a single PDF document using any standard tool, ready for upload to LinkedIn. This approach makes it a practical LinkedIn infographic maker for teams that prioritize speed and efficiency over intricate data visualization features or all-in-one export solutions.
Key Features:
- Pre-Sized Templates: A library of templates specifically sized for LinkedIn posts, banners, and infographics.
- Speed-Focused Editor: A lightweight drag-and-drop interface designed for maximum efficiency.
- Royalty-Free Assets: Access to a large collection of photos and graphics at no extra cost.
- Background Remover: One-click tool to easily remove image backgrounds.
Pricing:
- Starter: Free plan with 3 downloads per month.
- Pro: Starts at $10/month (billed annually), offering unlimited downloads and background removal.
- Team: Starts at $20/month (billed annually) for 5 users and team collaboration features.
| Pros | Cons |
|---|---|
| Extremely fast and simple to produce on-brand graphics. | Smaller asset library compared to platforms like Canva. |
| Ideal for teams needing quick content without complex tools. | Lacks advanced data visualization tools found in Visme. |
| Affordable pricing for individuals and small teams. | No direct multi-page PDF export for carousels. |
Best For: Marketing professionals and small teams who need a no-fuss, incredibly fast LinkedIn infographic maker for creating consistent daily or weekly content without a steep learning curve.
9. Envato Elements
Envato Elements is not a direct editor but an extensive subscription-based marketplace, making it an incredible asset for agencies and high-volume content creators. Instead of creating from scratch, you gain unlimited access to a massive library of professionally designed templates for LinkedIn infographics and carousels. Many of these templates are provided as editable files for popular tools like Canva, Photoshop, and Illustrator, offering a high-quality starting point.
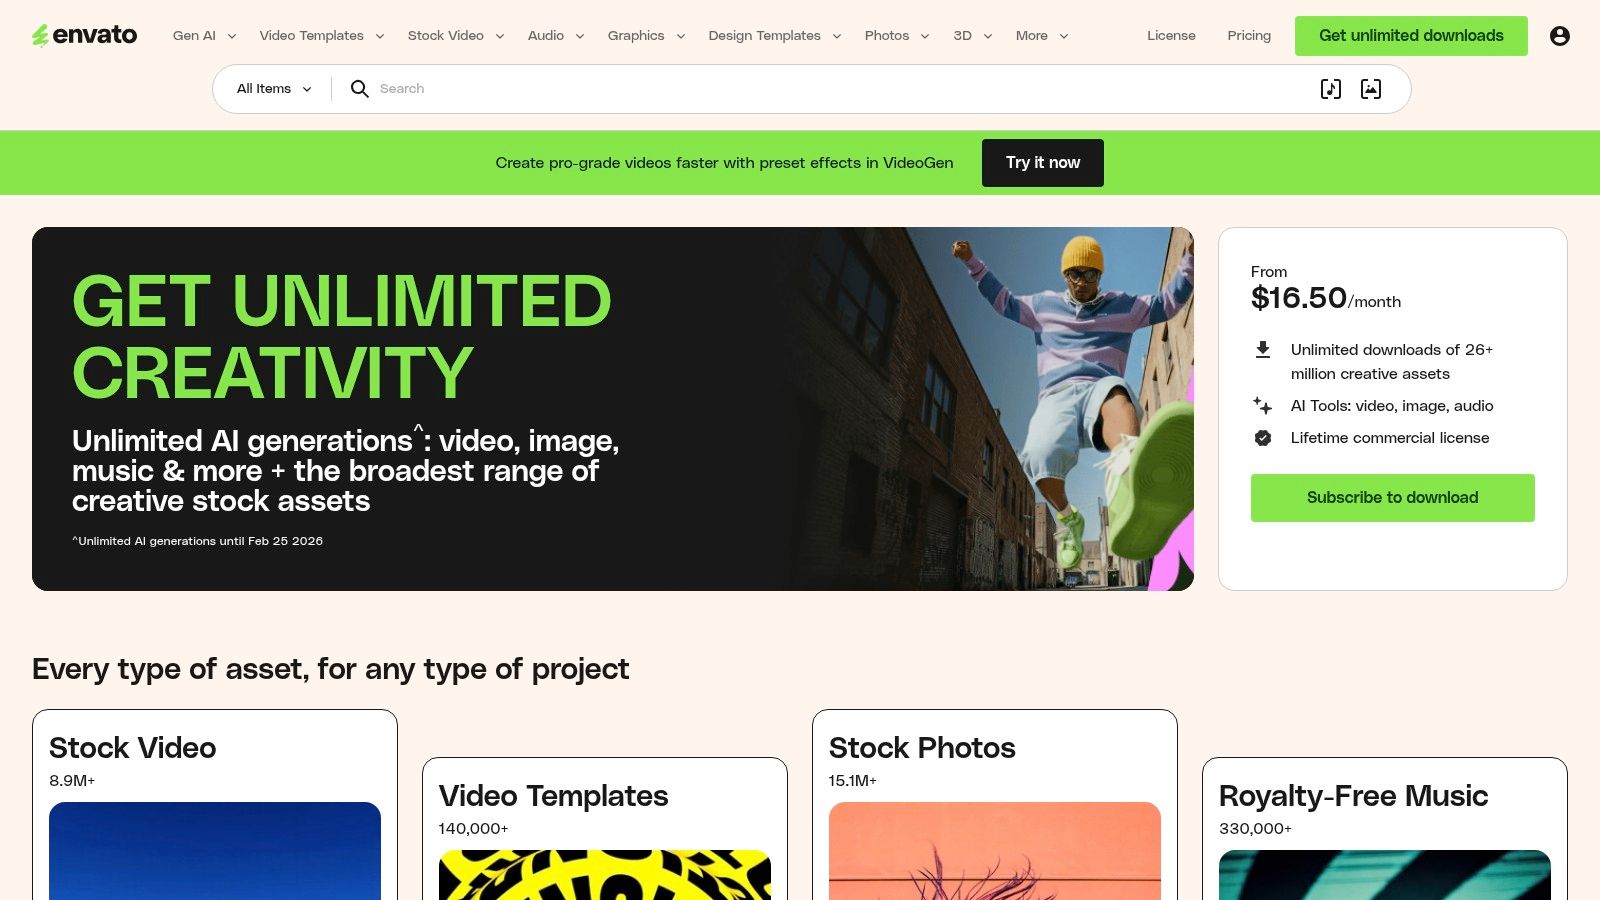
The primary advantage is the sheer volume and quality of assets available under a single, affordable subscription. This model is perfect for teams that need a constant stream of fresh, diverse creative assets without incurring per-item costs. All downloads come with a simple commercial license, so you can confidently use them for client work or your company’s brand, making it a reliable LinkedIn infographic maker resource for professional use.
Key Features:
- Unlimited Downloads: A single subscription provides unlimited access to millions of creative assets.
- Vast Template Library: Includes thousands of high-quality LinkedIn carousel and infographic templates.
- Multi-Platform Compatibility: Templates are available for Canva, Adobe Photoshop, and Illustrator.
- Simple Commercial Licensing: All assets are covered by one commercial license for peace of mind.
Pricing:
- Individual: Starts at $16.50/month (billed annually) for unlimited downloads.
- Teams: Starts at $10.75/month per member for teams of 5, with team management features.
| Pros | Cons |
|---|---|
| Extremely cost-effective for high-volume asset needs. | Requires an ongoing subscription; no single-purchase options. |
| High-quality, professionally designed templates. | Not an all-in-one editor; requires other software like Canva or Adobe. |
| One license covers all commercial use cases. | The sheer volume of assets can be overwhelming to browse through. |
Best For: Marketing agencies, freelance designers, and content teams that require a constant supply of diverse, high-quality templates for various clients or campaigns and already use design tools like Canva or Adobe Creative Cloud.
10. Creative Market
Creative Market offers a different approach, functioning as a marketplace for high-quality, professionally designed templates rather than a design tool itself. It's the ideal destination when you need a unique, niche-specific LinkedIn carousel or infographic pack without committing to another monthly subscription. You purchase templates à la carte, often editable in tools like Canva or Adobe Illustrator, giving you a premium starting point for your content.
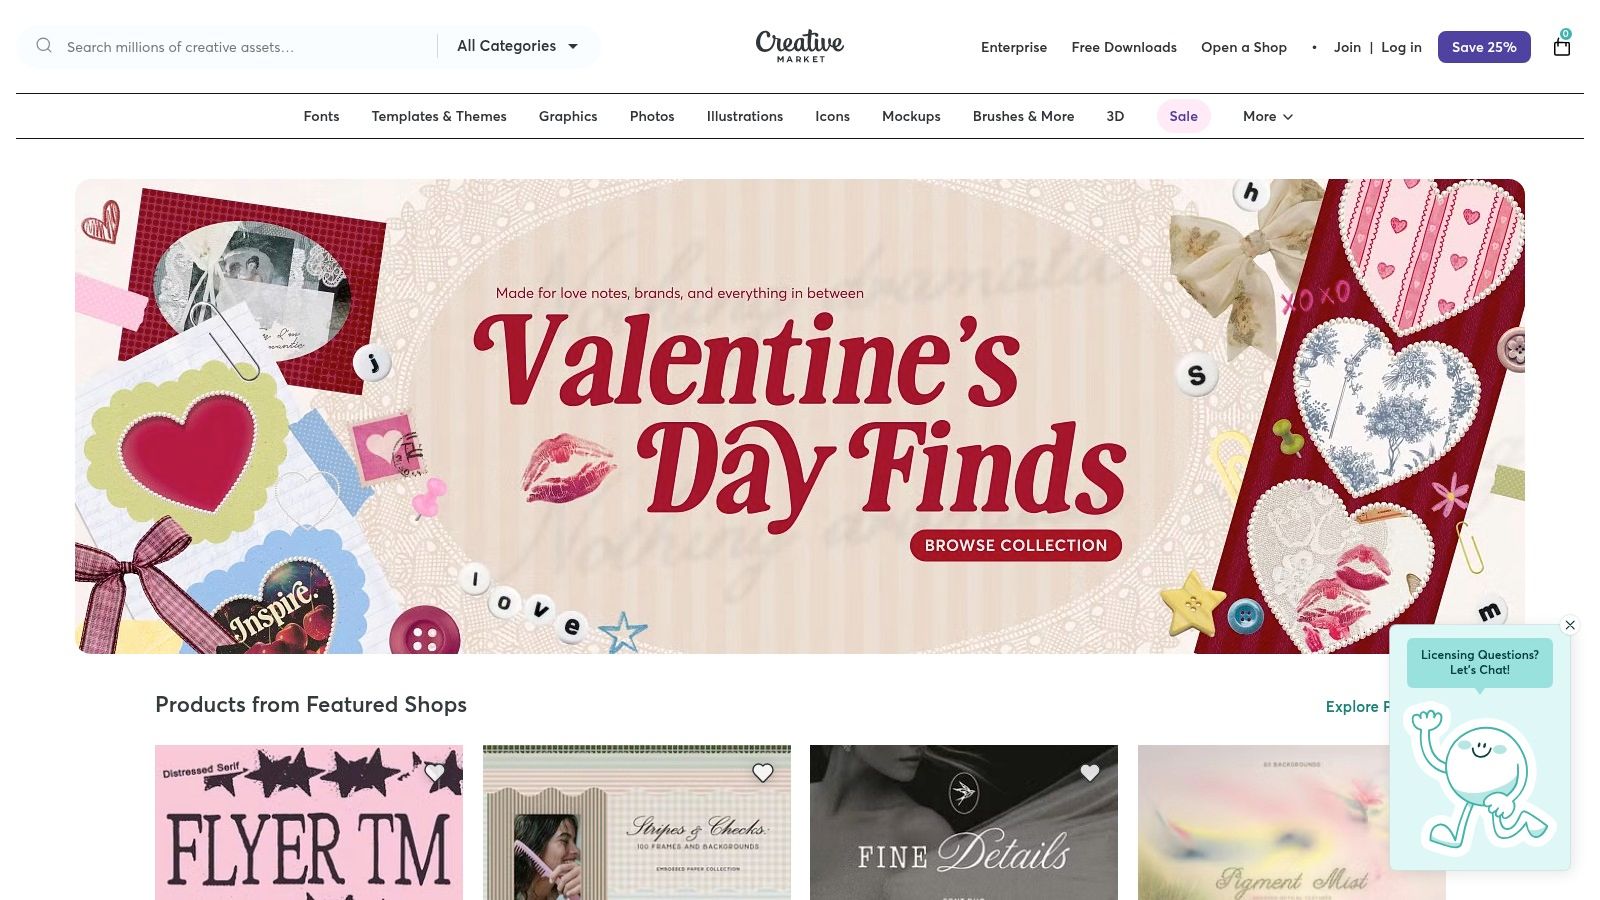
This model is perfect for finding templates tailored to specific industries like B2B SaaS, consulting, or personal branding, often designed by experts in those fields. Since you are buying from individual creators, it is crucial to review the seller's page, check the included file types (e.g., Canva link, .AI file), and carefully read the license terms for each purchase. This platform excels at providing specialized assets for thought leadership and product explainer carousels.
Key Features:
- À La Carte Purchases: Buy individual template packs with perpetual access to the files.
- Niche & Professional Designs: Access curated templates for specific industries and use cases.
- Seller-Managed Content: Direct interaction with designers through their store pages.
- Multi-Platform Compatibility: Templates are often provided for Canva, Figma, or Adobe Suite.
Pricing:
- Pay-Per-Item: Prices are set by the individual creator and vary per template, typically ranging from $15 to $50+. There is no subscription fee.
| Pros | Cons |
|---|---|
| One-off purchases mean no recurring subscription fees. | Quality and update support depend entirely on the individual seller. |
| Access to highly specialized and business-focused designs. | License terms can vary between items and must be read carefully. |
| Great for unique aesthetics to stand out from generic templates. | You still need a separate design tool (like Canva) to edit the files. |
Best For: Freelancers, consultants, and marketers looking for a unique or industry-specific LinkedIn infographic maker template without a monthly software commitment. It's a great source for premium assets to elevate your content beyond standard designs.
11. Etsy (Digital Templates)
For those who want a professionally designed foundation without the recurring subscription, Etsy is an unconventional but highly effective resource. The platform hosts a vast marketplace of digital templates created by independent designers, many of which are specifically tailored for LinkedIn carousels and infographics. These are typically one-time purchases that provide you with an editable Canva link, allowing for full customization.
The primary advantage is the sheer variety and affordability. You can find unique, niche-specific styles for industries like coaching, real estate, or tech that might not be available in mainstream tools. Most sellers provide instant digital downloads with clear instructions on how to access the Canva template and export the final PDF for LinkedIn. Before purchasing, it's crucial to review the shop's ratings and the specific license terms, as quality and usage rights can vary significantly between creators.
Key Features:
- Vast Marketplace: Hundreds of listings for LinkedIn carousel and post templates from independent designers.
- Canva-Editable: Most templates are delivered as a link to a fully editable Canva design.
- Instant Digital Downloads: Get immediate access to your purchased templates after payment.
- Seller Reviews: Built-in rating and review system helps vet the quality and reliability of sellers.
Pricing:
- One-Time Purchase: Varies by seller, but templates typically range from $5 to $30 for a complete set.
| Pros | Cons |
|---|---|
| Extremely budget-friendly with no recurring fees. | Quality and design consistency can vary widely between sellers. |
| Access to unique, niche-specific, and trendy designs. | License and usage rights differ; must be checked for each purchase. |
| Instant access and simple workflow using a familiar Canva link. | No direct platform features like scheduling or analytics. |
Best For: Solopreneurs, coaches, and small businesses on a tight budget who are comfortable using Canva and want a unique, professionally designed starting point for their LinkedIn content without a monthly subscription.
12. DocHipo
DocHipo is a user-friendly design tool that carves out a niche by offering a dedicated collection of LinkedIn carousel templates. It streamlines the creation process for this specific, high-engagement post format. The platform is built around a simple drag-and-drop editor, making it accessible for users who want to create professional-looking documents without a steep learning curve.
A significant advantage of DocHipo is its generous free plan, which allows users to download their creations in high-resolution PDF format without any watermarks. This is a key differentiator from many competitors that gate this feature. For brands looking to maintain visual consistency, the platform also includes basic brand kit tools to store logos and color palettes, ensuring every carousel aligns with your established identity.
Key Features:
- Dedicated Carousel Templates: A focused library of ready-to-use layouts specifically for LinkedIn document posts.
- Drag-and-Drop Editor: An intuitive interface for quick customization of text, images, and other design elements.
- Watermark-Free Exports: The free plan allows for high-quality, watermark-free PDF downloads.
- Brand Kit Tools: Store and apply brand assets like colors and logos for consistent designs.
Pricing:
- Free: Includes access to thousands of templates and watermark-free exports.
- Pro: Starts at $7.50/month per user (billed annually), adding premium templates, Brand Kit, and AI tools.
| Pros | Cons |
|---|---|
| Strong focus on LinkedIn carousel creation. | Smaller asset library and ecosystem than major players. |
| Free plan is very generous with watermark-free exports. | Fewer advanced design features and integrations. |
| Simple, easy-to-learn interface. | Primarily focused on static designs, not video or animation. |
Best For: Solopreneurs, freelancers, and small businesses who need a straightforward and cost-effective LinkedIn infographic maker specifically for creating high-quality carousels without the complexity or cost of larger design suites.
Honorable Mention: aiCarousels Infographic Generator
aiCarousels.com has launched a dedicated free LinkedIn infographic generator that deserves a mention because it ranks well for this exact search. The tool takes a text prompt and produces an infographic-style carousel in seconds, with no design skills required. A free tier covers basic use, while the Pro version adds more templates and removes branding.
What it does well: Speed. You paste a topic, hit generate, and get a styled infographic carousel almost immediately. The output is specifically sized for LinkedIn, so you skip the export-format guesswork.
Where it falls short: The template library is small compared to Canva or Venngage, customization is limited, and there is no built-in scheduling, analytics, or brand kit. The AI writes the copy for you, but you cannot feed it your own source material or knowledge base the way you can with Postiv AI. If your priority is a quick, free one-off infographic, aiCarousels works. If LinkedIn is a recurring channel, you will outgrow it quickly.
Pricing: Free tier available. Pro plan pricing varies.
Text-to-Infographic AI Tools: The 2026 Landscape
A growing category of tools converts plain text directly into infographic visuals without any manual design. This is the fastest workflow for LinkedIn creators who have written content (blog posts, reports, newsletters) and want to turn it into a visual carousel. The related search "AI infographic generator from text" has surged in 2026, and several tools compete here:
- Venngage AI Infographic Generator (free). Paste a text prompt, and the AI builds a full infographic with sections, headlines, and icons. The output is editable in Venngage's editor. Best for single-image infographics.
- Piktochart AI (free tier, 60 monthly AI credits). Upload a document or type a topic, and Piktochart generates an infographic layout in under 10 seconds. Stronger for data-heavy content than Venngage.
- QuillBot AI Infographic Generator (free). A newer entrant that transforms text into styled visuals quickly. The output quality is more basic than Venngage or Piktochart, but it is completely free with no account required.
- NoteGPT AI Infographic Generator. Converts notes, articles, and video transcripts into infographic layouts. Useful for repurposing long-form content into LinkedIn visuals, especially if you already use NoteGPT for note-taking.
- Gamma.app (free tier). Creates infographic-style presentations from prompts. The output works well as LinkedIn carousels when exported as PDF.
For LinkedIn specifically, the gap in most text-to-infographic tools is the last mile: exporting as a correctly sized PDF carousel and scheduling the post. End-to-end platforms like Postiv AI handle text-to-carousel-to-schedule in one step, which removes the copy-paste tax of using a separate generator and a separate posting tool.
What About Infogram and Data-Heavy Infographics?
If your LinkedIn content lives or dies on data, Infogram is the one tool the rest of this list does not replace. It ranks in the top results for "infographic maker" precisely because it specializes in chart-driven and interactive visuals: 35-plus chart types, live data connections (Google Sheets, Dropbox, JSON, SQL), and an AI assistant that suggests the right chart and converts a screenshot of a table back into editable data. For analysts, finance, and research-led creators, that depth beats a general design editor.
The catch for LinkedIn is the same last-mile problem. Infogram's interactive charts are built for embeds on a website, not for the feed. LinkedIn does not render live interactive infographics inline, so you still export a static PNG or a PDF and upload that as a single image or a document carousel. The interactivity is lost the moment it leaves Infogram.
So the practical 2026 stack is: use Infogram (or Visme) when a single chart needs to be accurate and credible, then drop that chart into a multi-slide carousel built in a LinkedIn-first tool like Postiv AI. You keep the data rigor of a charting tool and the swipe-through dwell time that the LinkedIn algorithm actually rewards, all exported in the 1080 x 1350 px PDF format the feed supports.
Top 12 LinkedIn Infographic Makers Comparison
| Tool | Core features ✨ | UX / Quality ★ | Value / Price 💰 | Target audience 👥 | Unique selling points ✨ |
|---|---|---|---|---|---|
| Postiv AI 🏆 | Brand-trained AI writer, on-platform carousel designer, scheduler, analytics, private knowledge library | ★★★★★ (fast, consistent; saves hours) | 💰 Pro $99/mo · Team $229/mo (3 seats) · $1 trials available | 👥 B2B founders, marketers, agencies, execs | ✨ All-in-one LinkedIn-first workflow; LinkedIn-compliant scheduling; 15+ EU languages |
| Canva | Drag-and-drop design, brand kit, huge template library, LinkedIn Ads app | ★★★★☆ (familiar, fast) | 💰 Free tier · Pro/Teams paid (rising team costs) | 👥 Non-designers, marketing teams, agencies | ✨ Magic Resize, direct Ads integration, vast templates |
| Adobe Express | Browser editor, 150+ LinkedIn carousel templates, generative AI assists, PDF export | ★★★★☆ (template-rich) | 💰 Free + Premium templates on subscription | 👥 Designers who want ready-made LinkedIn carousels | ✨ Adobe-quality templates + AI-assisted design |
| Visme | Charts, maps, interactive widgets, LinkedIn templates, multi-format export | ★★★★☆ (data-led visuals) | 💰 Paid plans; some features gated | 👥 Data teams, analysts, content marketers | ✨ Strong data visualization & interactivity for infographics |
| Venngage | 10,000+ infographic templates, AI editing, multi-format export | ★★★★☆ (template depth) | 💰 Freemium with Premium templates/exports | 👥 Non-designers making professional infographics | ✨ Huge template library tailored to professional topics |
| Piktochart | Infographics, LinkedIn-sized templates, AI tools, PDF/PNG export | ★★★★☆ (stat-focused clarity) | 💰 Free + Paid tiers for advanced exports | 👥 Communicators, analysts, educators | ✨ Quick stat-to-visual conversion with LinkedIn sizing |
| Kapwing | 4,400+ LinkedIn templates, collaborative browser editor, easy asset uploads | ★★★★☆ (quick, collaborative) | 💰 Freemium; subscription for pro features | 👥 Social creators, small teams, video editors | ✨ Large LinkedIn template library + video-friendly tools |
| Snappa | Lightweight drag-and-drop, LinkedIn post/banner templates, fast exports | ★★★★☆ (very fast) | 💰 Affordable subscription; simple tiers | 👥 Small teams, solopreneurs needing speed | ✨ Ultra-fast creation for on-brand LinkedIn graphics |
| Envato Elements | Unlimited downloads, Canva/PSD/AI files, commercial license | ★★★★☆ (professional assets) | 💰 Subscription (cost-effective for heavy users) | 👥 Agencies, studios, heavy template users | ✨ High-quality templates + commercial licensing |
| Creative Market | A‑la‑carte professional packs, Canva-editable templates, perpetual access | ★★★★☆ (curated, pay-per-item) | 💰 Pay-per-item (no subscription) | 👥 One-off buyers, boutique brands, designers | ✨ One-off purchases with niche, polished packs |
| Etsy (Digital Templates) | Independent Canva-editable templates, instant downloads, seller previews | ★★★☆☆ (varied quality) | 💰 Budget-friendly one-offs | 👥 Budget-conscious solopreneurs, niche creators | ✨ Very affordable, niche styles with instant access |
| DocHipo | LinkedIn carousel templates, drag-and-drop editor, brand kit, watermark-free free plan | ★★★★☆ (LinkedIn-focused, easy) | 💰 Free plan (watermark-free) · Paid for larger libraries | 👥 LinkedIn starters, small teams | ✨ Free exports, clear LinkedIn carousel guidance |
| aiCarousels | AI infographic generator, text-to-carousel, LinkedIn-sized output | ★★★☆☆ (fast but limited) | 💰 Free tier · Pro plan paid | 👥 Quick one-off creators | ✨ Fastest text-to-infographic for LinkedIn |
Is Canva or Piktochart Better for LinkedIn Infographics?
This is one of the most common questions when choosing a LinkedIn infographic maker, and the answer depends entirely on your content style. Both tools are excellent, but they serve different strengths.
Choose Canva if your priority is design flexibility and speed. Canva offers a significantly larger template library, an intuitive drag-and-drop editor, and seamless PDF export for LinkedIn carousels. Its Brand Kit (on paid plans) and Magic Resize feature make it easy to repurpose designs across platforms. Canva is the better generalist: ideal for teams that create a mix of social posts, presentations, and marketing materials alongside their LinkedIn content.
Choose Piktochart if your content is data-heavy. Piktochart was built for data visualization, offering specialized chart types, map widgets, and infographic canvases that Canva doesn't match. Its AI infographic generator can transform a text prompt into a structured data layout quickly. For consultants, analysts, and researchers who regularly present statistics on LinkedIn, Piktochart's focused toolkit delivers more polished data-driven visuals.
Choose an all-in-one platform like Postiv AI if you want the entire workflow handled: AI writing, infographic carousel design, scheduling, and analytics in one place without switching between tools. This eliminates the copy-paste friction of using separate writing and design apps.
| Criteria | Canva | Piktochart | Postiv AI |
|---|---|---|---|
| Template variety | 10,000+ | 800+ | 25+ carousel blueprints |
| Data visualization | Basic charts | Advanced charts, maps, widgets | AI-generated data layouts |
| AI features | Magic Write, image generation | AI infographic generator | Full AI writer + designer |
| PDF carousel export | Yes | Yes | Yes |
| LinkedIn scheduling | No | No | Yes (multi-profile) |
| Best for | Design generalists | Data-focused content | End-to-end LinkedIn workflow |
How to Create LinkedIn Infographics with AI
AI-powered infographic creation has exploded in 2026, with tools like Gemini, ChatGPT, and dedicated platforms making it possible to go from a text prompt to a finished visual in minutes. Here's how to leverage AI for your LinkedIn infographic workflow:
Method 1: AI-First Platforms (Fastest)
The fastest approach uses a platform that combines AI writing and design. With a tool like Postiv AI, you enter your topic, data points, or source content, and the AI generates both the copy and the visual carousel layout. You then customize colors, fonts, and branding before exporting as a PDF ready for LinkedIn. This method takes 5-10 minutes from start to finish.
Method 2: AI Content + Manual Design
Use ChatGPT, Claude, or Gemini to generate the text content and structure for your infographic (outline, key stats, slide copy), then design it manually in Canva, Piktochart, or Visme. This gives you more design control but adds 30-60 minutes to the process. Tools like Venngage also offer an AI infographic generator that creates a first draft from a text prompt, which you can then refine in their editor.
Method 3: AI Image Generation
For single-image infographics (not carousels), you can use Gemini's image generation or ChatGPT with DALL-E to create infographic-style visuals directly from a prompt. The results have improved dramatically but still require careful prompting to get clean, data-accurate layouts. This method works best for simple stat highlights rather than complex multi-section infographics.
Regardless of which method you choose, always review AI-generated content for accuracy, apply your brand kit for visual consistency, and optimize your dimensions for LinkedIn (1080 x 1350 px for carousels). For more on building a repeatable content process, see our guide to scaling content creation.
Can ChatGPT Create Infographics?
Yes, ChatGPT can generate infographics, but its strengths and limits matter for LinkedIn. With the built-in image tool, ChatGPT produces single-image visuals well suited to stat highlights, simple quote cards, and metaphor-driven graphics. Where it struggles is precise data charts, consistent typography across a multi-slide carousel, and brand kit adherence. The pixel layout tends to drift between generations, which breaks the clean, repeatable look LinkedIn carousels need.
The most reliable workflow is ChatGPT for copy, dedicated maker for design. Prompt ChatGPT with your topic, source data, and desired slide count. Ask for a structured output: hook slide, three to five insight slides with one data point each, and a closing CTA slide. Then paste those slides into an AI-powered LinkedIn infographic maker like Postiv AI or a template tool like Canva. The maker handles the chart accuracy, brand colors, and PDF export so the final carousel looks native to the feed. This hybrid approach is faster than designing from scratch and cleaner than asking ChatGPT to do everything.
How to Use Gemini (and Nano Banana) for LinkedIn Infographics
Gemini has emerged as the go-to AI for infographic prototyping in 2026, largely because its Nano Banana image model produces cleaner typography and more coherent layouts than earlier tools. The workflow that works best on LinkedIn:
- Go to gemini.google.com and select the Thinking model.
- Enable the Create Images tool (or use Canvas for editable outputs).
- Paste a structured prompt: "Create a 1080 x 1350 px portrait infographic titled [topic]. Use [N] numbered sections, a clean minimal style, [color 1] background, [color 2] accent color, sans-serif typography. Include these data points: [data]. Leave space for a brand logo in the corner."
- Upload reference images of infographics you like to anchor the style.
- Iterate slide by slide. For carousels, generate each slide with consistent instructions so fonts and colors match.
- Export the final visuals and assemble them into a PDF before uploading to LinkedIn.
Gemini handles single-image infographics beautifully, but LinkedIn carousels still benefit from a dedicated tool for the PDF export and multi-slide consistency. Pair Gemini's visual output with a scheduler like Postiv AI to move from prompt to published post in one sitting.
Mobile-First Design for LinkedIn Infographics
Roughly 60 percent of LinkedIn sessions happen on a phone, which means every infographic decision should optimise for the small screen first. Desktop is a bonus, not the baseline. Here is the mobile-first checklist most creators skip:
- Dimensions: Use 1080 x 1350 px portrait. Square (1080 x 1080) works on desktop but loses 25 percent of mobile feed real estate to whitespace.
- Type size: Body copy at 24 pt minimum, headlines at 48 pt or larger. Anything smaller becomes illegible at thumbnail scale.
- Single focus per slide: One headline, one data point, one visual element. Two ideas per slide doubles the chance the reader bounces.
- Edge padding: 80 px on every side. LinkedIn crops the preview tile and aggressive padding prevents text amputation.
- Contrast: 4.5:1 between text and background. Light grey on white is the most common readability failure on mobile.
- Thumbnail test: Preview your exported PDF at iPhone thumbnail size. If you cannot identify the headline in two seconds, redesign it.
The right LinkedIn infographic maker enforces these defaults out of the box. Postiv AI exports every carousel at 1080 x 1350 with safe-zone padding pre-applied, so the mobile-first work happens automatically.
LinkedIn Infographic Templates by Industry
Generic templates produce generic engagement. The infographic patterns that convert vary by industry and audience because the format has to mirror how that audience reads and decides. Match the template to the use case:
B2B SaaS and Consulting
Comparison tables, framework matrices (2x2 grids), and ROI calculators dominate. Buyers in these categories are evaluating options, so side-by-side layouts and decision frameworks earn the save. Pair each carousel with one cited stat per slide.
Coaches and Personal Brands
Quote cards, single-stat highlights, and three-step process flows. The audience is scrolling for inspiration and quick frameworks they can apply that afternoon. Keep the design clean, lean on bold typography, and reserve one slide for a story or transformation arc.
Agencies and Service Businesses
Before/after case-study layouts and client-result visualisations. Show the metric that moved (revenue, leads, hires) with the timeframe and the lever you pulled. Anonymise the client only if contractually required; named case studies generate 2x the inbound DMs.
Recruiters and HR
Timeline infographics for career milestones and hiring funnels, plus salary comparison charts. The audience wants benchmarks and visual maps of progression. Avoid stock corporate photography in the background; clean illustration converts better.
Healthcare, Legal, Finance
Data-heavy statistical infographics with cited sources baked into the slide. Compliance-sensitive industries need every claim attributable, so bake the source URL or citation directly into the design. Use process diagrams for explaining regulations or treatment pathways step by step.
For ready-to-edit templates that match each of these patterns, browse our LinkedIn carousel examples gallery or start from one of the 25+ infographic blueprints inside Postiv AI.
Accessibility and Alt Text for LinkedIn Infographics
Almost no creators add alt text to their LinkedIn carousels, which is both an accessibility miss and a missed ranking signal. The algorithm uses alt text to understand image content, so accessible infographics tend to surface in more searches and feed slots.
How to add alt text on LinkedIn:
- Upload your PDF carousel as a document post.
- After upload, hover over each slide preview in the composer.
- Click the pencil icon and add a one to two sentence description per slide.
- Cover the headline, the key data point, and the visual element (chart type, framework, before/after).
Design-level accessibility rules to follow:
- Contrast ratio of at least 4.5:1 between text and background (WCAG AA standard).
- Sans-serif fonts at 24 pt or larger. Avoid thin display weights at small sizes.
- Never encode data with colour alone. Pair colour with shape, label, or pattern so colour-blind readers can still parse the chart.
- Plain-text chart legends. Put the legend in a real text layer outside the image where possible, so screen readers and LinkedIn's own indexing can read it.
- Avoid text inside images of charts. If you embed a screenshot of a chart, transcribe the key numbers into the slide caption.
Accessible carousels reach more people and tend to outperform on dwell time because the design is by definition simpler and more readable. It is one of the highest-ROI tweaks you can make on existing infographic posts.
The 3/2/1 Rule for Infographic LinkedIn Posts
The 3/2/1 rule is a content structure that pairs especially well with infographic carousels. The framework is simple: three sentences that stop the scroll, two insights that deliver real value, and one clear call to action. It mirrors how LinkedIn readers actually consume the feed, skimming first, then committing, then acting.
Applied to an infographic carousel, the rule becomes a visual swipe-through:
- Slide 1 (the 3): Three punchy lines that tease the payoff. This is your hook. Example: "Your LinkedIn posts flop. Text alone drowns in the feed. Here is the fix."
- Slides 2-4 (the 2): Two core insights, each expanded across one or two slides with a data point, a chart, or a mini framework.
- Final slide (the 1): One call to action. Save, comment, follow, or book. Do not stack multiple CTAs.
Using the 3/2/1 rule inside an infographic format compounds engagement because the structure rewards the swipe. Each slide closes one loop and opens the next, which is exactly what the LinkedIn algorithm rewards with dwell time. For more frameworks that drive saves and comments, see our engagement post ideas guide.
Choosing the Right Maker for Your LinkedIn Goals
Navigating the crowded landscape of design tools can feel overwhelming, but finding the right LinkedIn infographic maker is the first step toward transforming your content strategy. As we've explored, the ideal solution isn't a one-size-fits-all answer. Your choice hinges on a clear understanding of your specific goals, resources, and workflow. From comprehensive, AI-powered platforms to specialized design suites and simple template marketplaces, each tool offers a distinct path to creating compelling visuals.
The key takeaway is to move beyond just features and focus on fit. A solo founder's priority might be speed and efficiency, making an all-in-one tool like Postiv AI a game-changer. Conversely, a marketing agency managing multiple clients will likely prioritize robust collaboration features, brand kits, and approval workflows, leaning toward solutions like Canva Teams or Visme. For those who simply need a design asset to plug into an existing content calendar, template-focused options like Envato Elements or Creative Market provide immense value without the monthly commitment.
How to Make Your Final Decision
Before you commit, audit your current content creation process. Ask yourself these critical questions:
- Where is my biggest bottleneck? Is it writing the initial copy, designing the visuals, or scheduling the final post? If writing and ideation are the main hurdles, an AI-driven tool is your best bet. If design is the primary challenge, a template-rich platform like Canva or Adobe Express is a strong contender.
- What is my primary content format? If your strategy revolves around data-driven reports and complex charts, specialized tools like Venngage and Piktochart offer superior functionality for visualizing data. If you're focused on text-heavy carousels and brand storytelling, other platforms may be more suitable.
- How important is team collaboration? For agencies and in-house marketing teams, features like shared folders, real-time commenting, and brand kits are non-negotiable. Evaluate the team plans of each tool to ensure they support your collaborative needs without creating friction.
- Do I need an end-to-end solution? Juggling separate tools for writing, design, and scheduling can kill productivity. An integrated platform that handles the entire lifecycle of a LinkedIn post, from idea to publication, offers a significant advantage for lean teams and busy professionals.
By answering these questions honestly, you can narrow down the list from twelve great options to the one or two that are perfectly suited to your operational reality. Ultimately, the best LinkedIn infographic maker is the one that you will use consistently to produce high-quality content that captivates your audience and drives meaningful engagement.
Frequently Asked Questions
What is an infographic on LinkedIn?
A LinkedIn infographic is any visual where the design carries the information rather than just decorating it. The most common formats are data visualisations and stat callouts, step-by-step process diagrams, comparison or before/after layouts, and framework matrices. On LinkedIn these usually appear as a single 1080 x 1350 px image or as a multi-slide PDF carousel. The format wins because LinkedIn's algorithm rewards dwell time, and a well-built infographic keeps eyes on the post far longer than a wall of text.
How do I design a LinkedIn infographic for mobile?
Mobile-first. Roughly 60 percent of LinkedIn sessions happen on a phone, so design every infographic for a small screen first and let it scale up to desktop. Use 1080 x 1350 px portrait slides, keep body text at 24 pt or larger, leave 80 px of padding around every edge, and limit each slide to one core idea with one visual element. Test by previewing the PDF at thumbnail size on your own phone before posting. See the mobile-first design checklist above for the full breakdown.
Are LinkedIn infographics accessible? How do I add alt text?
Add alt text on every slide during the LinkedIn upload step. Use the pencil icon on each carousel preview to write a one to two sentence description per slide covering the headline, the key data point, and the visual element. Beyond alt text, maintain a 4.5:1 contrast ratio, use sans-serif fonts at 24 pt or larger, and avoid colour-only data encoding. Accessible infographics also rank better because LinkedIn uses alt text as a relevance signal. See the accessibility section above for the full checklist.
What LinkedIn infographic templates work for B2B vs personal brands?
Match the template to the audience. B2B SaaS and consulting wins with comparison tables, ROI calculators, and framework matrices. Coaches and personal brands convert best with quote cards, single-stat highlights, and three-step process flows. Agencies should lean on case-study before/after layouts. Recruiters thrive with timeline infographics and salary comparison charts. See the templates-by-industry breakdown above for niche-specific patterns.
How does the LinkedIn algorithm treat infographic posts?
The LinkedIn algorithm treats infographic carousels as document posts, which receive a boost because each swipe signals strong engagement. The system tracks dwell time per slide, saves, shares, and comments. Carousels typically generate 1.5x to 3x the reach of a text-only post and around 24 percent average engagement rate. To maximise the boost, hook on slide one, keep slides between 8 and 12, end with a clear CTA, and post when your audience is online.
Do infographics perform well on LinkedIn?
Yes. Infographics consistently outperform text-only posts on LinkedIn. Visual content can receive up to 400% more reach, and infographic-style carousels generate high dwell time because users swipe through each slide. The algorithm rewards that engagement signal with broader distribution, making infographics one of the most effective formats for thought leadership and brand awareness. For more on maximizing visual content engagement, see our guide to LinkedIn carousel best practices.
What size should a LinkedIn infographic be?
For single-image infographics, use 1080 x 1080 px (square) or 1080 x 1350 px (portrait, recommended). For multi-slide infographic carousels uploaded as a PDF, each page should be 1080 x 1350 px or 1280 x 1600 px. LinkedIn supports PDF documents up to 100 MB and 300 pages. For a complete breakdown of every dimension, check our LinkedIn graphic dimensions reference.
Can I make a LinkedIn infographic for free?
Several tools on this list offer free plans that work well for LinkedIn infographics. Canva, DocHipo, and Piktochart all have free tiers with usable templates and export options including PDF. Venngage and Adobe Express also offer limited free plans. For AI-powered infographic creation, Postiv AI offers a trial so you can test the full workflow before committing.
What is the difference between a LinkedIn infographic and a carousel?
A LinkedIn infographic is a single image that presents data, statistics, or ideas in a visual format. A carousel is a multi-page document (usually a PDF) that users swipe through. Many top-performing creators combine both approaches by designing infographic-style slides and uploading them as a carousel. This hybrid format maximizes both visual appeal and dwell time. Learn how to build one step by step in our how to create a LinkedIn carousel guide.
How do I create a LinkedIn infographic with AI?
Open an AI-powered LinkedIn infographic maker like Postiv AI, enter your topic or paste source content (a blog post, PDF, or video), and let the AI generate slides with data-driven layouts and visuals. Customize the design with your brand colors and fonts, then export as a PDF carousel or PNG image and upload directly to LinkedIn. The entire process takes minutes instead of hours.
Is Canva or Piktochart better for LinkedIn infographics?
It depends on your priorities. Canva is more versatile with a larger template library and broader design tools for social media, presentations, and marketing materials. Piktochart is stronger for data visualization, offering specialized charts, maps, and infographic layouts. For LinkedIn specifically, Canva's PDF export and Brand Kit make it a solid all-rounder, while Piktochart excels when your content is data-heavy. See our detailed comparison above for a full breakdown.
What is the best free LinkedIn infographic maker?
The best free options are Canva (generous free tier with templates and PDF export), DocHipo (watermark-free PDF downloads for free), and Piktochart (free access with basic templates). Venngage and Adobe Express also offer limited free plans. For AI-powered infographic creation, Postiv AI provides a trial so you can test the full carousel workflow before committing. If you need to create LinkedIn carousels specifically, prioritize tools with native PDF export.
What types of infographics work best on LinkedIn?
The most engaging LinkedIn infographic formats are data-driven posts with statistics and charts, process flows showing step-by-step guides, comparison layouts for versus-style content, timelines for milestones and growth stories, and framework matrices that package thought leadership. Carousel-format infographics consistently outperform single images because each swipe signals engagement to the LinkedIn algorithm. For more on high-performing content formats, see our guide to types of LinkedIn posts.
Can AI generate infographics for LinkedIn?
Yes. Tools like Venngage, Piktochart, and Postiv AI offer AI infographic generators that create layouts from text prompts. You can also use ChatGPT or Google Gemini to draft infographic content and then design it in a visual editor. For LinkedIn specifically, AI-powered carousel makers like Postiv AI handle both copy generation and slide design in one step, reducing creation time from hours to minutes.
What are the best design tips for LinkedIn infographics?
Use 1080 x 1350 px portrait slides for maximum feed real estate, keep text to under 30 words per slide, maintain high contrast with a 4.5:1 color ratio, use one key data point per slide, and include a strong hook on slide one. Export as PDF for carousel uploads. Consistent branding across slides builds recognition and compounds engagement over time. For a complete breakdown of design principles, see our LinkedIn carousel best practices guide.
What are the 7 types of infographics?
The seven main types are statistical (data and charts), informational (topic overviews), timeline (chronological events or milestones), process (step-by-step flows), comparison (side-by-side evaluations), geographic (map-based data), and hierarchical (ranked structures or org charts). On LinkedIn, statistical and comparison infographics tend to perform best because they deliver quick, concrete takeaways that professionals save and share. See our detailed breakdown above for guidance on when to use each type.
Can I turn text into an infographic automatically?
Yes. Tools like Venngage, Piktochart, and Postiv AI can convert a text prompt or pasted article into a structured infographic layout in seconds. Paste your blog post, report summary, or key data points into the tool, choose a template or let the AI pick one, then customize colors and branding before exporting. This text-to-infographic workflow typically takes under five minutes and eliminates the need for manual design skills.
What are common mistakes when creating infographics with AI?
The most common mistakes are overcrowding slides with too much text or data, ignoring brand colors and fonts so the result looks generic, relying on AI-generated images for precise data charts (use real chart tools instead), and publishing without proofreading for factual accuracy. Always review AI output, apply your brand kit, and keep each slide focused on one key point.
Is there a difference between infographic makers and infographic video makers?
Traditional infographic makers create static images or PDFs. Some newer tools like Biteable and Animaker let you create animated or video infographics that play as short clips. For LinkedIn, static carousel infographics (PDF format) still outperform video infographics in most cases because carousels generate higher dwell time per swipe. However, animated infographics can work well for LinkedIn video posts when the goal is to explain a complex process quickly.
What is the 3/2/1 rule on LinkedIn?
The 3/2/1 rule is a LinkedIn content structure: three sentences that stop the scroll, two insights that deliver real value, and one clear call to action. It pairs perfectly with infographic carousels because each beat maps to a slide, with slide one as the hook, slides two to four as the insight payload, and the final slide as the CTA. See our 3/2/1 breakdown above for a carousel-specific example.
Can ChatGPT create infographics?
Yes. ChatGPT can generate infographic visuals through its built-in image tool, which works well for single-image stat highlights and simple metaphors. For data-accurate charts and consistent multi-slide carousels, it is more reliable to use ChatGPT for the copy and outline, then design the actual visuals in a dedicated LinkedIn infographic maker like Postiv AI, Canva, or Piktochart. This hybrid workflow produces polished carousels that the LinkedIn algorithm rewards with higher reach.
How do I use Gemini (Nano Banana) to make a LinkedIn infographic?
Go to Gemini, select the Thinking model, and enable the Create Images (Nano Banana) tool. Prompt with a structured request that includes the exact dimensions (1080 x 1350 px), the style, colors, typography, and the data points you want visualized. Upload reference images to anchor the aesthetic, iterate slide by slide, and export each slide. Assemble the slides into a PDF for the LinkedIn carousel upload. See the full Gemini workflow above.
Is there a free LinkedIn infographic maker online?
Yes. The fully free options are Canva (free tier with PDF carousel export), DocHipo (watermark-free PDF on the free plan), Piktochart (basic templates free), Venngage (limited free plan with Venngage branding on exports), and Adobe Express (free plan with core editing and a starter template library). Postiv AI is not free but offers a $1 trial so you can build a full infographic carousel end-to-end before paying full price. For LinkedIn specifically, prioritize tools that export PDF on the free tier because carousel uploads require it. See our free options breakdown above for the ranked list.
What is the best AI LinkedIn infographic generator?
An AI LinkedIn infographic generator turns a text prompt, pasted article, or set of data points into a finished infographic layout automatically. The best options in 2026 are Postiv AI (AI writer plus carousel designer in one workflow), Venngage AI, Piktochart AI, and prompt-based models like Gemini Nano Banana for single-image visuals. Postiv AI is purpose-built for LinkedIn carousels, so it exports PDFs in the correct 1080 x 1350 px slides and includes scheduling. See the AI generator breakdown above for which flavor fits your volume.
Should I use online infographic maker software or a desktop app?
A web app like Postiv AI, Canva, or Piktochart runs entirely in the browser. No installation, no Mac vs Windows limit, files synced across devices. Desktop software like Adobe Illustrator or Photoshop gives you more pixel-level control but adds licensing cost and a steeper learning curve. For LinkedIn infographics specifically, an online maker is almost always the better choice because the final output is a 1080 x 1350 px PDF and you do not need print-grade fidelity.
Which AI is best for creating LinkedIn infographics?
Gemini's Nano Banana model produces clean typography and consistent layouts, which makes it the leading prompt-based image generator for LinkedIn infographics in 2026. ChatGPT's image tool is improving but is less reliable for multi-slide carousels. Lovart and other AI image tools can match Gemini for single-image stat highlights. For full carousel workflows where each slide needs to share fonts, colors, and a brand kit, a dedicated AI carousel maker like Postiv AI outperforms prompt-only tools because it enforces consistency across all slides at once.
What is the best AI prompt for a LinkedIn infographic?
Use a structured prompt that names the exact dimensions, the style, the color palette, and the data points. Template: "Create a 1080 x 1350 px portrait infographic titled [topic]. Use [N] numbered sections in a clean minimal style. Background [color]. Accent [color]. Typography sans-serif. Include these data points [data]. Leave a corner for the brand logo." Upload a reference image of an infographic style you like to anchor the design. For carousels, repeat the prompt slide by slide with the same style instructions so the fonts and colors stay consistent. See the full Gemini prompt template above.
Can I convert text to a LinkedIn infographic with AI?
Yes. Several AI tools convert plain text into infographic layouts automatically. Venngage and Piktochart both offer free AI infographic generators that accept a text prompt and return a styled visual. QuillBot and NoteGPT also provide text-to-infographic features. For LinkedIn carousels specifically, paste your text into an end-to-end tool like Postiv AI, which generates slides from your content and exports a correctly sized PDF in one step. See the full text-to-infographic landscape above for a tool-by-tool breakdown.
Is aiCarousels a good free LinkedIn infographic maker?
aiCarousels.com offers a free LinkedIn infographic generator that creates carousel-style infographics from a text prompt. The free tier works for basic one-off designs. For recurring posting with brand consistency, scheduling, and analytics, a full-featured platform like Postiv AI or Canva is a better long-term fit. See our aiCarousels review above for a detailed breakdown.
Do I own the copyright to an AI-generated LinkedIn infographic?
Usually yes, but check the plan. Most AI infographic makers grant you commercial rights to the visual you generate, so you can post it on LinkedIn and use it for client work. Watch two things. First, free tiers often add a watermark or limit commercial use until you upgrade, with Venngage and Canva being common examples. Second, AI-generated images and icons can carry separate terms from the layout itself. Always read the tool's license page, and for client deliverables keep a record of which tool produced each asset.
How long does it take to create a LinkedIn infographic with AI?
Generating the first draft takes seconds. Tools like Piktochart AI, Venngage, and aiCarousels return a styled infographic in under 10 seconds from a text prompt. The real time goes into refinement: editing copy, correcting data, adjusting colors to your brand, and splitting a single-image layout into a multi-slide carousel. Budget 10 to 20 minutes end to end for a polished LinkedIn carousel. An all-in-one tool like Postiv AI shortens this further because the AI writes on-brand copy and builds every slide at once, so you skip the copy-paste step between a writer and a designer.
What should a LinkedIn infographic include?
A strong LinkedIn infographic includes a hook headline that states the payoff, one core idea per slide, and a single supporting visual such as a chart, icon, or number. Add a credible data point with its source, keep body text at 24 pt or larger for mobile, and use no more than two or three brand colors. Close with a clear call to action on the final slide. Avoid cramming multiple stats onto one slide, and never rely on color alone to convey meaning, pair it with a label or shape for accessibility.
Is Infogram good for LinkedIn infographics?
Infogram is one of the strongest tools for data-heavy and interactive infographics, with 35-plus chart types and live data connections to sources like Google Sheets and SQL. The limit is the LinkedIn feed, which does not render interactive infographics inline. You export a static PNG or PDF and upload that, so the interactivity is lost. The best workflow is to build accurate charts in Infogram or Visme, then drop them into a multi-slide PDF carousel made in a LinkedIn-first tool like Postiv AI for the swipe-through dwell time the algorithm rewards. See the data-heavy infographics section above for the full workflow.
Ready to stop juggling tools and start creating high-impact LinkedIn content in minutes? Postiv AI combines AI-powered writing, automated design, and seamless scheduling into one platform built specifically for LinkedIn. Try Postiv AI today and see how easy it is to build your brand and generate results.